

Can we identify genes for alcohol consumption in samples ascertained for heterogeneous purposes?
- PMID: 19183129
- PMCID: PMC3164813
- DOI: 10.1111/j.1530-0277.2008.00890.x
Can we identify genes for alcohol consumption in samples ascertained for heterogeneous purposes?
Abstract
Background: Previous studies have identified evidence of genetic influence on alcohol use in samples selected to be informative for alcoholism research. However, there are a growing number of genome-wide association studies (GWAS) using samples unselected for alcohol consumption (i.e., selected on other traits and forms of psychopathology), which nevertheless assess consumption as a risk factor. Is it reasonable to expect that genes contributing to variation in alcohol consumption can be identified in such samples?
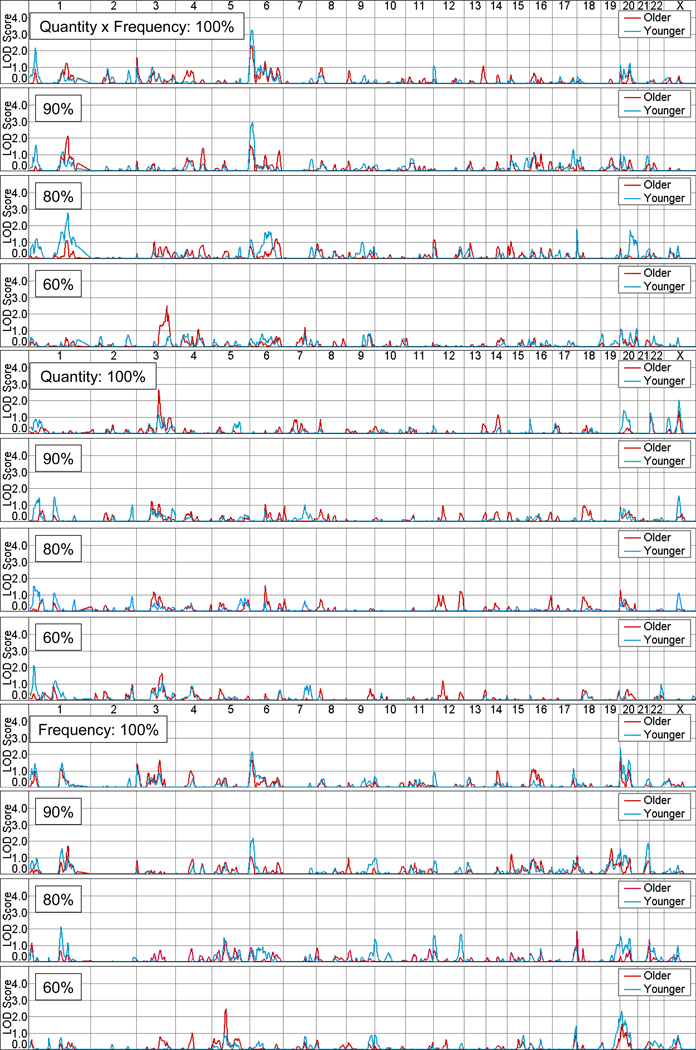
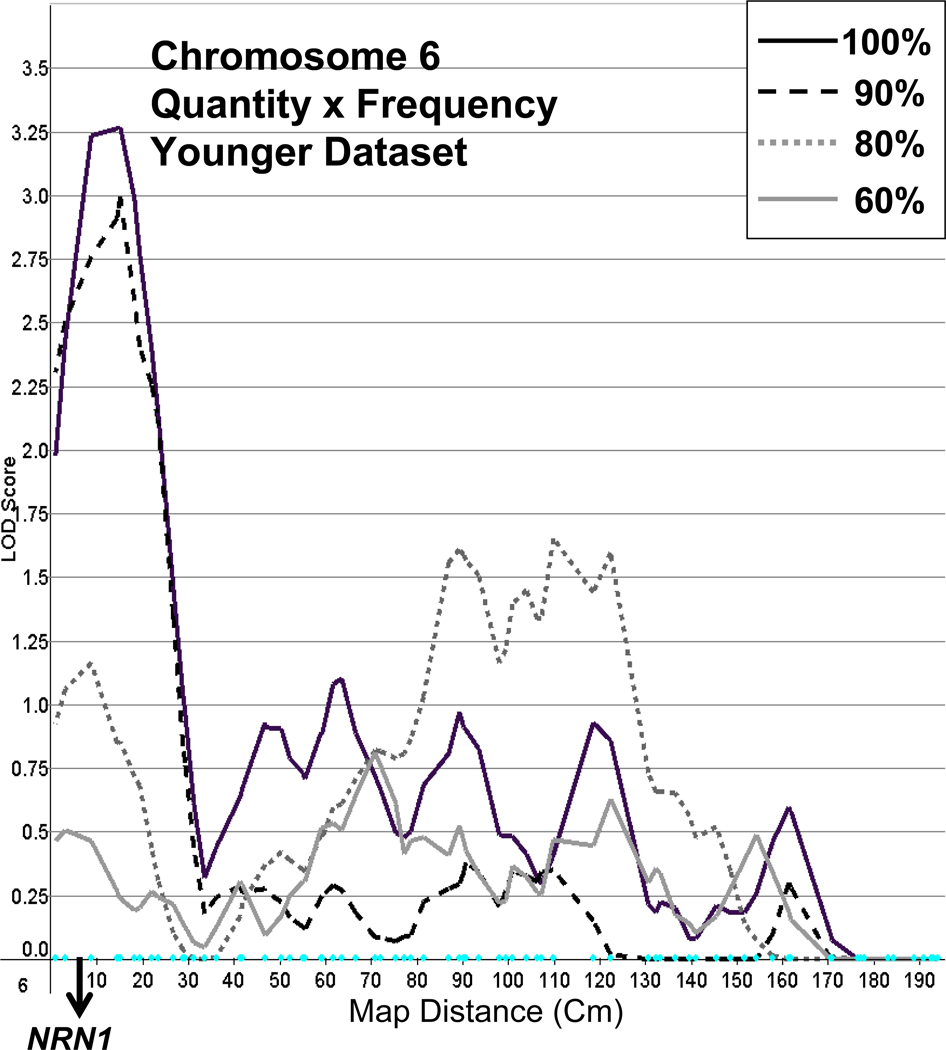
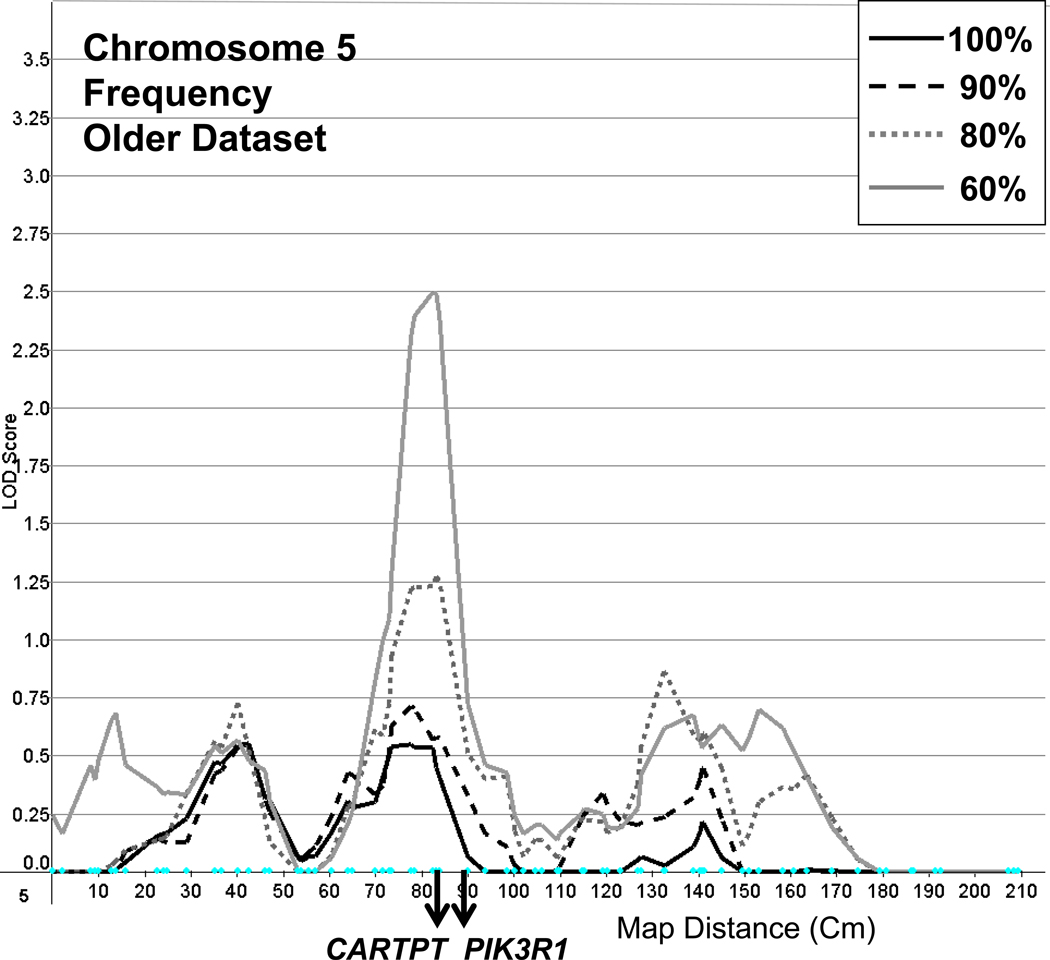
Methods: An exploratory approach was taken to determine whether linkage analyses for heaviness of alcohol consumption, using a sample collected for heterogeneous purposes, could replicate previous findings. Quantity and frequency measures of consumption were collected in telephone interviews from community samples. These measures, and genotyping, were available for 5,441 individuals (5,067 quasi-independent sibling pairs). For 1,533 of these individuals, data were collected on 2 occasions, about 8.2 years apart, providing 2 datasets that maximize data collected at either a younger or an older age. Analyses were conducted to address the question of whether age and heavier levels of alcohol consumption effects outcome. Linkage results were compared in the younger and older full samples, and with samples in which approximately 10, 20, and 40 of drinkers from the lower end of the distribution of alcohol consumption were dropped.
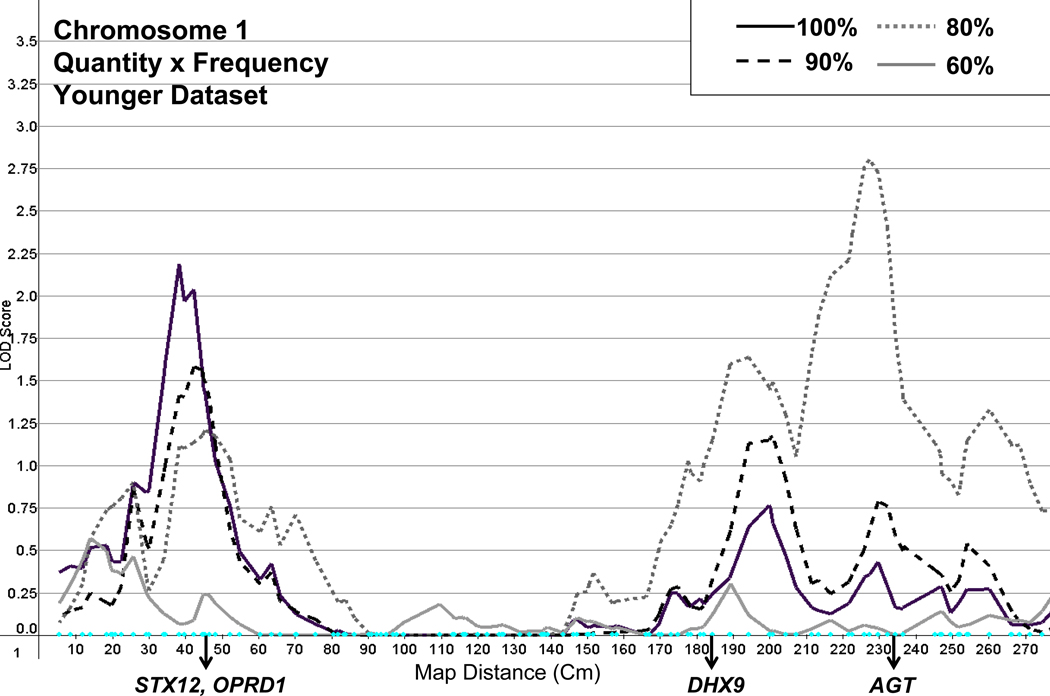
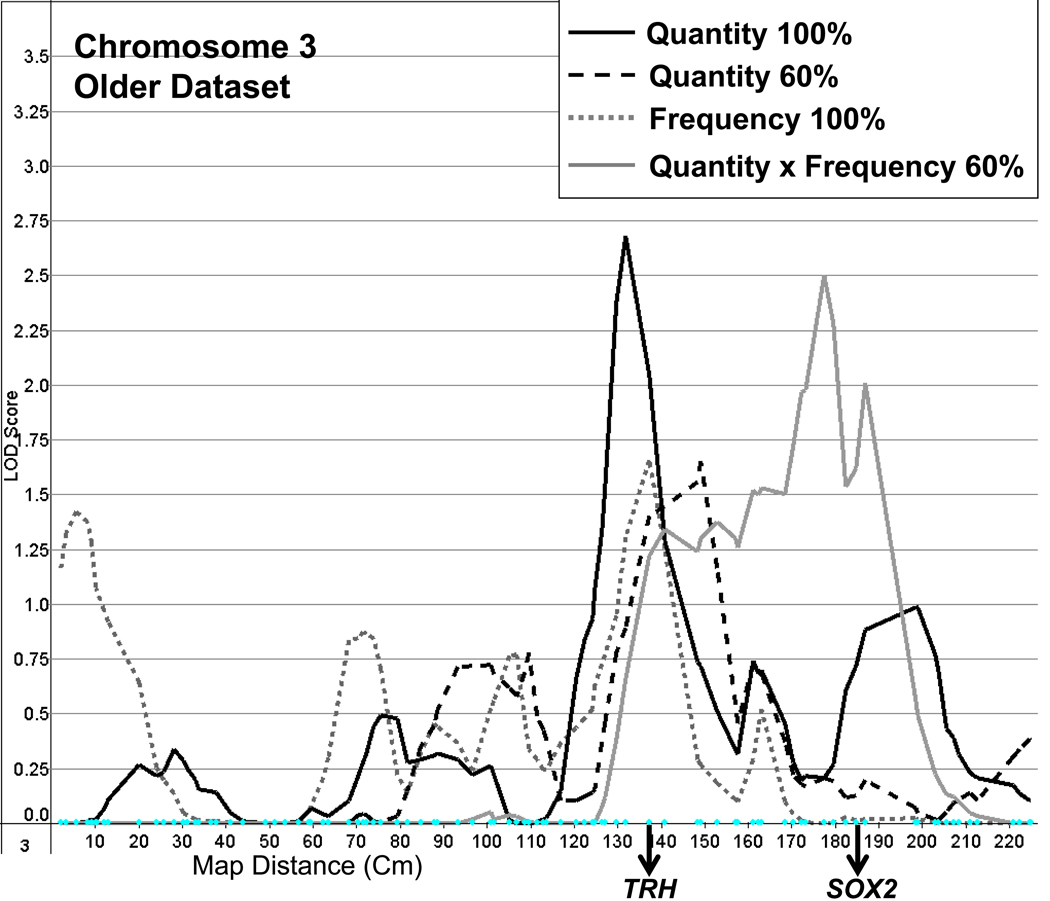
Results: Linkage peaks varied for the age differentiated samples and for percentage of light drinkers retained. Larger peaks (LOD scores >2.0) were typically found in regions previously identified in linkage studies and/or containing proposed candidate genes for alcoholism including AGT, CARTPT, OPRD1, PIK3R1, and PDYN.
Conclusions: The results suggest that GWAS assessing alcohol consumption as a covariate for other conditions will have some success in identifying genes contributing to consumption-related variation. However, sample characteristics, such as participant age, and trait distribution, may have substantial effects on the strength of the genetic signal. These results can inform forthcoming GWAS where the same restrictions apply.
Figures
References
-
- Abecasis GR, Cherny SS, Cookson WO, Cardon LR. GRR: graphical representation of relationship errors. Bioinformatics. 2001;17:742–743. - PubMed
-
- Abecasis GR, Cherny SS, Cookson WO, Cardon LR. Merlin-rapid analysis of dense genetic maps using sparse gene flow trees. Nat Genetics. 2002;30:97–101. - PubMed
-
- Agrawal A, Hinrichs AL, Dunn G, Bertelsen S, Dick DM, Saccone SF, Saccone NL, Grucza RA, Wang JC, Cloninger CR, Edenberg HJ, Foroud T, Hesselbrock V, Kramer J, Bucholz KK, Kuperman S, Nurnberger JIJ, Porjesz B, Schuckit MA, Goate AM, Bierut LJ. Linkage scan for quantitative traits identifies new regions of interest for substance dependence in the Collaborative Study on the Genetics of Alcoholism (COGA) sample. Drug Alcohol Depend. 2007;93(1–2):12–20. - PMC - PubMed
-
- Beeby HN, Medland SE, Martin NG. ViewPoint and ViewDist: utilities for rapid graphing of linkage distributions and identification of outliers. Behav Genet. 2006;36(1):7–11. - PubMed
-
- Benyamin B, Perola M, Cornes BK, Madden PAF, Palotie A, Nyholt DR, Montgomery GW, Peltonen L, Martin NG, Visscher PM. Within-family outliers: segregating alleles or environmental effects? A linkage analysis of height from 5815 sibling pairs. Eur J Hum Genet. 2008;16:516–524. - PubMed
Publication types
MeSH terms
Substances
Grants and funding
- DA019951/DA/NIDA NIH HHS/United States
- R01 AA014041/AA/NIAAA NIH HHS/United States
- AA13320/AA/NIAAA NIH HHS/United States
- P50 AA011998/AA/NIAAA NIH HHS/United States
- R01 AA007728/AA/NIAAA NIH HHS/United States
- R01 AA013321/AA/NIAAA NIH HHS/United States
- AA07728/AA/NIAAA NIH HHS/United States
- AA11998/AA/NIAAA NIH HHS/United States
- R01 DA012854/DA/NIDA NIH HHS/United States
- R37 AA007728/AA/NIAAA NIH HHS/United States
- DA023668/DA/NIDA NIH HHS/United States
- AA13326/AA/NIAAA NIH HHS/United States
- R01 AA013320/AA/NIAAA NIH HHS/United States
- DA12854/DA/NIDA NIH HHS/United States
- R01 DA023668/DA/NIDA NIH HHS/United States
- AA13321/AA/NIAAA NIH HHS/United States
- AA10248/AA/NIAAA NIH HHS/United States
- R01 AA013326/AA/NIAAA NIH HHS/United States
- R56 DA012854/DA/NIDA NIH HHS/United States
- AA014041/AA/NIAAA NIH HHS/United States
- R01 AA010249/AA/NIAAA NIH HHS/United States
- K08 DA019951/DA/NIDA NIH HHS/United States
LinkOut - more resources
Full Text Sources
Medical
Miscellaneous
