Machine learning approach identifies new pathways associated with demyelination in a viral model of multiple sclerosis
- PMID: 19183246
- PMCID: PMC3837619
- DOI: 10.1111/j.1582-4934.2008.00646.x
Machine learning approach identifies new pathways associated with demyelination in a viral model of multiple sclerosis
Abstract
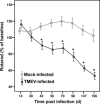
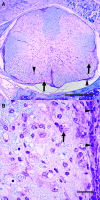
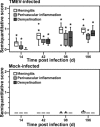
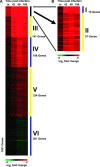
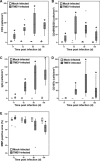
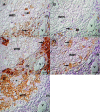
Theiler's murine encephalomyelitis is an experimentally virus-induced inflammatory demyelinating disease of the spinal cord, displaying clinical and pathological similarities to chronic progressive multiple sclerosis. The aim of this study was to identify pathways associated with chronic demyelination using an assumption-free combined microarray and immunohistology approach. Movement control as determined by rotarod assay significantly worsened in Theiler's murine encephalomyelitis -virus-infected SJL/J mice from 42 to 196 days after infection (dpi). In the spinal cords, inflammatory changes were detected 14 to 196 dpi, and demyelination progressively increased from 42 to 196 dpi. Microarray analysis revealed 1001 differentially expressed genes over the study period. The dominating changes as revealed by k-means and functional annotation clustering included up-regulations related to intrathecal antibody production and antigen processing and presentation via major histocompatibility class II molecules. A random forest machine learning algorithm revealed that down-regulated lipid and cholesterol biosynthesis, differentially expressed neurite morphogenesis and up-regulated toll-like receptor-4-induced pathways were intimately associated with demyelination as measured by immunohistology. Conclusively, although transcriptional changes were dominated by the adaptive immune response, the main pathways associated with demyelination included up-regulation of toll-like receptor 4 and down-regulation of cholesterol biosynthesis. Cholesterol biosynthesis is a rate limiting step of myelination and its down-regulation is suggested to be involved in chronic demyelination by an inhibition of remyelination.
Figures
Similar articles
-
The level of viral infection of antigen-presenting cells correlates with the level of development of Theiler's murine encephalomyelitis virus-induced demyelinating disease.J Virol. 2015 Feb;89(3):1867-78. doi: 10.1128/JVI.02471-14. Epub 2014 Nov 26. J Virol. 2015. PMID: 25428872 Free PMC article.
-
More severe neurologic deficits in SJL/J male than female mice following Theiler's virus-induced CNS demyelination.Exp Neurol. 2003 Mar;180(1):14-24. doi: 10.1016/s0014-4886(02)00054-7. Exp Neurol. 2003. PMID: 12668145
-
Central Nervous System Demyelination and Remyelination is Independent from Systemic Cholesterol Level in Theiler's Murine Encephalomyelitis.Brain Pathol. 2016 Jan;26(1):102-19. doi: 10.1111/bpa.12266. Epub 2015 Jun 10. Brain Pathol. 2016. PMID: 25959295 Free PMC article.
-
Excessive Innate Immunity Steers Pathogenic Adaptive Immunity in the Development of Theiler's Virus-Induced Demyelinating Disease.Int J Mol Sci. 2021 May 17;22(10):5254. doi: 10.3390/ijms22105254. Int J Mol Sci. 2021. PMID: 34067536 Free PMC article. Review.
-
Two models of multiple sclerosis: experimental allergic encephalomyelitis (EAE) and Theiler's murine encephalomyelitis virus (TMEV) infection. A pathological and immunological comparison.Microsc Res Tech. 1995 Oct 15;32(3):215-29. doi: 10.1002/jemt.1070320305. Microsc Res Tech. 1995. PMID: 8527856 Free PMC article. Review.
Cited by
-
Reactive Oxygen Species Are Key Mediators of Demyelination in Canine Distemper Leukoencephalitis but not in Theiler's Murine Encephalomyelitis.Int J Mol Sci. 2019 Jun 30;20(13):3217. doi: 10.3390/ijms20133217. Int J Mol Sci. 2019. PMID: 31262031 Free PMC article.
-
Axonopathy is associated with complex axonal transport defects in a model of multiple sclerosis.Brain Pathol. 2012 Jul;22(4):454-71. doi: 10.1111/j.1750-3639.2011.00541.x. Epub 2011 Nov 17. Brain Pathol. 2012. PMID: 21988534 Free PMC article.
-
Transcriptome analysis following neurotropic virus infection reveals faulty innate immunity and delayed antigen presentation in mice susceptible to virus-induced demyelination.Brain Pathol. 2021 Nov;31(6):e13000. doi: 10.1111/bpa.13000. Epub 2021 Jul 6. Brain Pathol. 2021. PMID: 34231271 Free PMC article.
-
Facets of Theiler's Murine Encephalomyelitis Virus-Induced Diseases: An Update.Int J Mol Sci. 2019 Jan 21;20(2):448. doi: 10.3390/ijms20020448. Int J Mol Sci. 2019. PMID: 30669615 Free PMC article. Review.
-
Interferon-stimulated genes-essential antiviral effectors implicated in resistance to Theiler's virus-induced demyelinating disease.J Neuroinflammation. 2015 Dec 24;12:242. doi: 10.1186/s12974-015-0462-x. J Neuroinflammation. 2015. PMID: 26703877 Free PMC article.
References
-
- Trapp BD, Nave KA. Multiple sclerosis: an immune or neurodegenerative disorder. Annu Rev Neurosci. 2008;31:247–69. - PubMed
-
- Lucchinetti C, Bruck W, Parisi J, et al. Heterogeneity of multiple sclerosis lesions: implications for the pathogenesis of demyelination. Ann Neurol. 2000;47:707–17. - PubMed
-
- Kutzelnigg A, Lucchinetti CF, Stadelmann C, et al. Cortical demyelination and diffuse white matter injury in multiple sclerosis. Brain. 2005;128:2705–12. - PubMed
Publication types
MeSH terms
LinkOut - more resources
Full Text Sources
Medical

