

Specific inhibition of hypoxia inducible factor 1 exaggerates cell injury induced by in vitro ischemia through deteriorating cellular redox environment
- PMID: 19183269
- PMCID: PMC2666308
- DOI: 10.1111/j.1471-4159.2009.05877.x
Specific inhibition of hypoxia inducible factor 1 exaggerates cell injury induced by in vitro ischemia through deteriorating cellular redox environment
Abstract
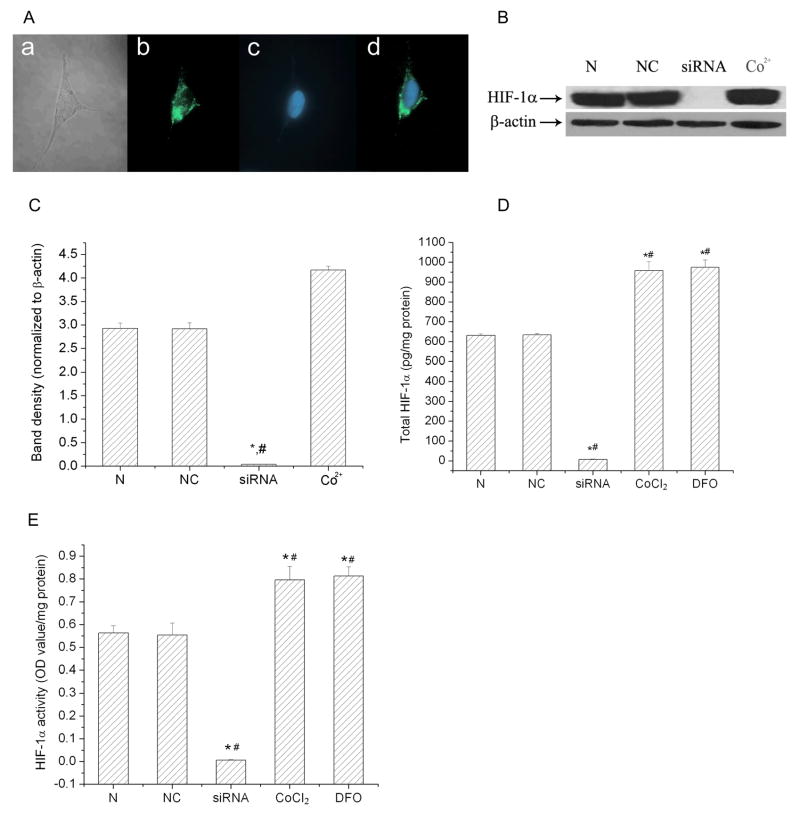
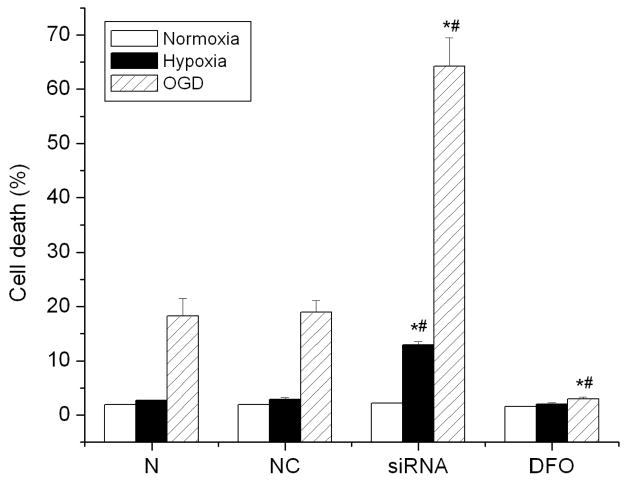
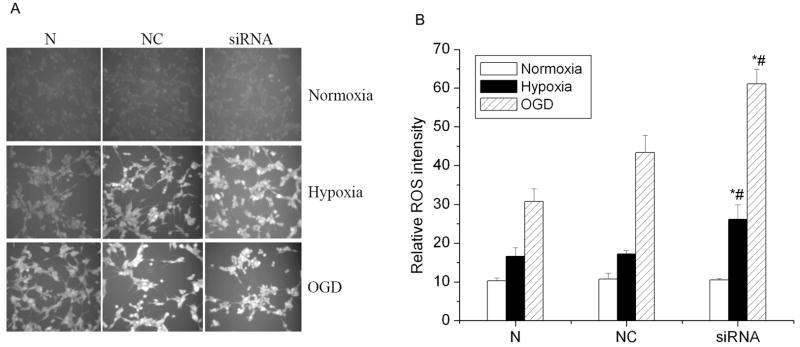
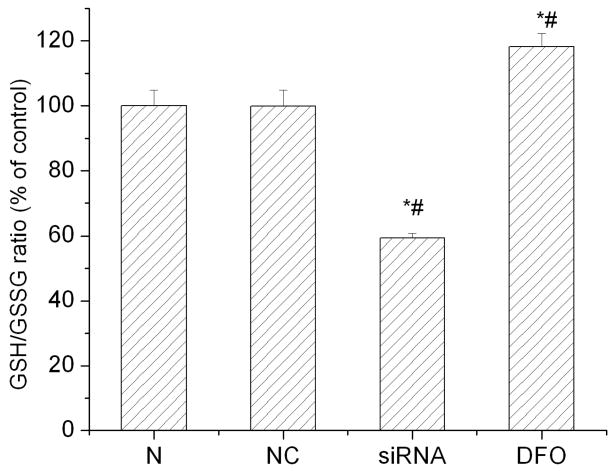
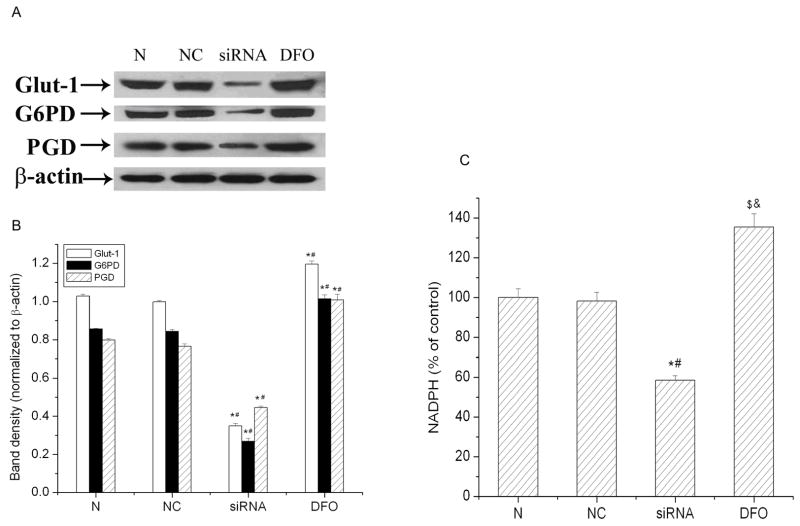
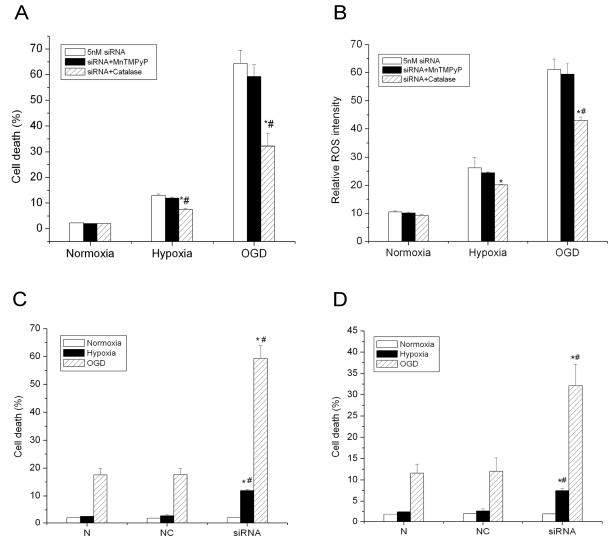
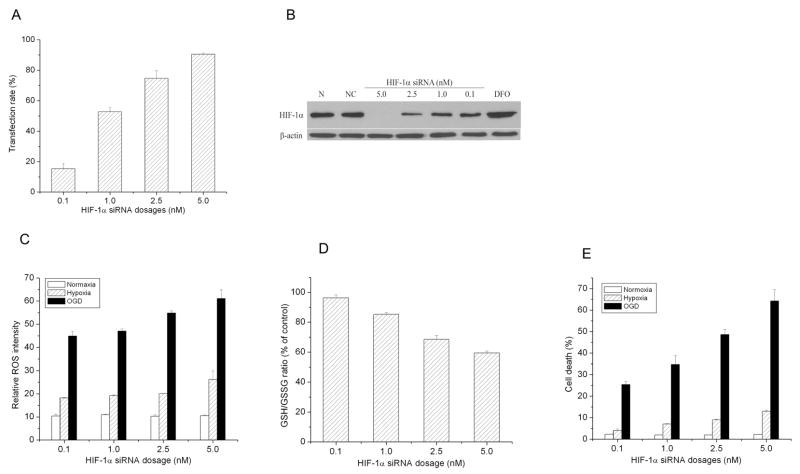
Hypoxia inducible factor 1 (HIF-1) has been suggested to play a critical role in the fate of cells exposed to hypoxic stress. However, the mechanism of HIF-1-regulated cell survival is still not fully understood in ischemic conditions. Redox status is critical for decisions of cell survival, death and differentiation. We investigated the effects of inhibiting HIF-1 on cellular redox status in SH-SY5Y cells exposed to hypoxia or oxygen and glucose deprivation (OGD), coupled with cell death analyses. Our results demonstrated that inhibiting HIF-1alpha expression by HIF-1alpha specific small interfering RNA (siRNA) transfection increased reactive oxygen species generation, and transformed the cells to more oxidizing environments (low GSH/GSSG ratio, low NADPH level) under either hypoxic or OGD exposure. Cell death increased dramatically in the siRNA transfected cells, compared to non-transfected cells after hypoxic/OGD exposures. In contrast, increasing HIF-1alpha expression by desferrioxamine, a metal chelator and hydroxylase inhibitor, induced a more reducing environment (high GSH/GSSG ratio, high NADPH level) and reduced cell death. Further studies showed that HIF-1 regulated not only glucose transporter-1 expression, but also the key enzymes of the pentose phosphate pathway such as glucose-6-phosphate dehydrogenase and 6-phosphogluconate dehydrogenase. These enzymes are important in maintaining cellular redox homeostasis by generating NADPH, the primary reducing agent in cells. Moreover, catalase significantly decreased cell death in the siRNA-transfected cells induced by hypoxia and OGD. These results suggest that maintenance of cellular redox status by HIF-1 protects cells from hypoxia and ischemia mediated injuries.
Figures

Similar articles
-
Role of Hypoxia-Inducible Factors 1α (HIF1α) in SH-SY5Y Cell Autophagy Induced by Oxygen-Glucose Deprivation.Med Sci Monit. 2018 May 4;24:2758-2766. doi: 10.12659/MSM.905140. Med Sci Monit. 2018. PMID: 29724989 Free PMC article.
-
Glucose up-regulates HIF-1 alpha expression in primary cortical neurons in response to hypoxia through maintaining cellular redox status.J Neurochem. 2008 Jun;105(5):1849-60. doi: 10.1111/j.1471-4159.2008.05287.x. Epub 2008 Feb 7. J Neurochem. 2008. PMID: 18266932
-
Endoplasmic reticulum stress regulates oxygen-glucose deprivation-induced parthanatos in human SH-SY5Y cells via improvement of intracellular ROS.CNS Neurosci Ther. 2018 Jan;24(1):29-38. doi: 10.1111/cns.12771. Epub 2017 Oct 16. CNS Neurosci Ther. 2018. PMID: 29045036 Free PMC article.
-
Cellular redox status regulates hypoxia inducible factor-1 activity. Role in tumour development.J Exp Clin Cancer Res. 2007 Mar;26(1):39-50. J Exp Clin Cancer Res. 2007. PMID: 17550131 Review.
-
Prodeath or prosurvival: two facets of hypoxia inducible factor-1 in perinatal brain injury.Exp Neurol. 2009 Mar;216(1):7-15. doi: 10.1016/j.expneurol.2008.10.016. Epub 2008 Nov 11. Exp Neurol. 2009. PMID: 19041643 Free PMC article. Review.
Cited by
-
Role of Hypoxia Inducible Factor 1 in Hyperglycemia-Exacerbated Blood-Brain Barrier Disruption in Ischemic Stroke.Neurobiol Dis. 2016 Nov;95:82-92. doi: 10.1016/j.nbd.2016.07.012. Epub 2016 Jul 16. Neurobiol Dis. 2016. PMID: 27425889 Free PMC article.
-
PI3K/Akt and HIF‑1 signaling pathway in hypoxia‑ischemia (Review).Mol Med Rep. 2018 Oct;18(4):3547-3554. doi: 10.3892/mmr.2018.9375. Epub 2018 Aug 9. Mol Med Rep. 2018. PMID: 30106145 Free PMC article. Review.
-
Competitive HIF Prolyl Hydroxylase Inhibitors Show Protection against Oxidative Stress by a Mechanism Partially Dependent on Glycolysis.ISRN Neurosci. 2013 Dec 5;2013:598587. doi: 10.1155/2013/598587. eCollection 2013. ISRN Neurosci. 2013. PMID: 25006572 Free PMC article.
-
Mechanism Governing Human Kappa-Opioid Receptor Expression under Desferrioxamine-Induced Hypoxic Mimic Condition in Neuronal NMB Cells.Int J Mol Sci. 2017 Jan 20;18(1):211. doi: 10.3390/ijms18010211. Int J Mol Sci. 2017. PMID: 28117678 Free PMC article.
-
Antioxidative effects of Panax notoginseng saponins in brain cells.Phytomedicine. 2014 Sep 15;21(10):1189-95. doi: 10.1016/j.phymed.2014.05.004. Epub 2014 Jun 7. Phytomedicine. 2014. PMID: 24916704 Free PMC article.
References
-
- Almeida A, Delgado-Esteban M, Bolanos JP, Medina JM. Oxygen and glucose deprivation induces mitochondrial dysfunction and oxidative stress in neurones but not in astrocytes in primary culture. J Neurochem. 2002;81:207–217. - PubMed
-
- Averill-Bates DA, Przybytkowski E. The role of glucose in cellular defences against cytotoxicity of hydrogen peroxide in Chinese hamster ovary cells. Arch Biochem Biophys. 1994;312:52–58. - PubMed
-
- Bergeron M, Yu AY, Solway KE, Semenza GL, Sharp FR. Induction of hypoxia-inducible factor-1 (HIF-1) and its target genes following focal ischaemia in rat brain. Eur J Neurosci. 1999;11:4159–4170. - PubMed
-
- Bernaudin M, Marti HH, Roussel S, Divoux D, Nouvelot A, MacKenzie ET, Petit E. A potential role for erythropoietin in focal permanent cerebral ischemia in mice. J Cereb Blood Flow Metab. 1999;19:643–651. - PubMed
Publication types
MeSH terms
Substances
Grants and funding
LinkOut - more resources
Full Text Sources
