. 2008 Dec;19(5):328-34.

Optimizing electroporation conditions in primary and other difficult-to-transfect cells

Affiliations

Optimizing electroporation conditions in primary and other difficult-to-transfect cells

Elizabeth T Jordan et al. J Biomol Tech. 2008 Dec.

Abstract

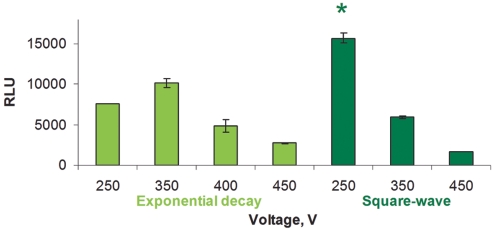
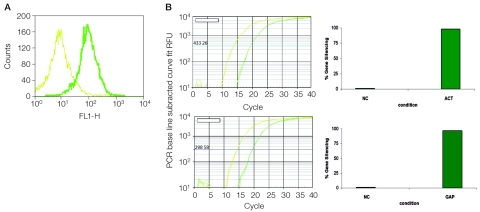
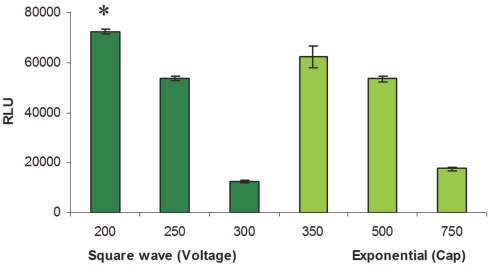
Electroporation is a valuable tool for nucleic acid delivery because it can be used for a wide variety of cell types. Many scientists are shifting toward the use of cell types that are more relevant to in vivo applications, including primary cells, which are considered difficult to transfect. The ability to electroporate these cell types with nucleic acid molecules of interest at a relatively high efficiency while maintaining cell viability is essential for elucidating the pathway(s) in which a gene product is involved. We present data demonstrating that by optimizing electroporation parameters, nucleic acid molecules can be delivered in a highly efficient manner. We display transfection results for primary and difficult-to-transfect cell types including human primary fibroblasts, human umbilical vein endothelial cells, Jurkat cells, and two neuroblastoma cell lines [SK-N-SH (human) and Neuro-2A (mouse)] with plasmid DNAs and siRNAs. Our data demonstrate that by determining proper electroporation conditions, glyceraldehyde phosphate dehydrogenase mRNA was silenced in Jurkat cells when compared with negative control siRNA electroporations as early as 4 h post-transfection. Other experiments demonstrated that optimized electroporation conditions using a fluorescently labeled transfection control siRNA resulted in 75% transfection efficiency for Neuro-2A, 93% for human primary fibroblasts, and 94% for HUVEC cells, as analyzed by flow cytometry.

Keywords: HUVEC; Jurkat; MXcell; Neuro-2a; SK-N-SH; electroporation; human primary fibroblasts; mammalian cells; neuroblastoma; primary cells transfection.


Figures

FIGURE 1
FIGURE 1
Electroporation of HUVEC cells with pCMVI-Luc plasmid and Gene Pulser electroporation buffer, using exponential or square-wave conditions. Luciferase assay results are expressed in relative light units. The exponential wave electroporations varied the voltage and kept a constant capacitance (500 μF) and resistance (1000 Ω; light green). The square-wave electroporations varied the voltage and kept a constant pulse duration of 20 msec (dark green). *The condition providing the highest luciferase activity. RLU, relative light units.
FIGURE 2
FIGURE 2
Electroporation of HUVEC cells with siRNA. A: Overlaid histograms showing fluorescence of cells treated with electroporation buffer, but not electroporated (light green), and cells electroporated with fluorescent transfection control siRNA (dark green). B: RT-qPCR traces 24 h after electroporation using cDNA prepared from cells electroporated with β-actin siRNA (top panel, dark green) or negative control (top panel, light green) and GAPDH siRNA (bottom panel, dark green) or negative control (bottom panel,light green). ACT, β-actin siRNA; RFU, RFUGAQP; GAPDH siRNA; NC, negative control; RFU, relative light units. The corresponding qPCR results are expressed as percentage gene silencing in the right-most panels. Electroporation conditions used were A: exponential decay (350 V, 500 μF, 1000 Ω) and B: square-wave (250 V, 2000 μF, 1000 Ω, 20 msec).
FIGURE 3
FIGURE 3
Electroporation of HPF cells with siRNA and plasmid DNA, using an exponential wave pulse of 250 V, 500 μF, 1000 Ω. A: Flow cytometry results 24 h post-electroporation of 100-nM fluorescent TC siRNA or 20 μg/mL pEGFP. The results show the percentage of transfected cells. B: RT-qPCR results 24 h post-electroporation of 100 nM GAPDH and negative control siLentMer siRNA. qPCR traces are shown in the middle, and results expressed as percentage of gene silencing are shown on the right. HPF, human primary fibroblasts; NC, negative control; RLU, relative light units.
FIGURE 4
FIGURE 4
Luciferase activity 24 h after electroporation of Jurkat cells. An exponential waveform was used to determine the optimal conditions for electroporation. A: Optimization of voltage at 300 μF and 1000 Ω. B: Optimization of capacitance at 250 V and 1000 Ω. Results are expressed in RLU, relative light units. *, The condition providing the highest luciferase expression.
FIGURE 5
FIGURE 5
Time course of GAPDH gene silencing in Jurkat cells. Jurkat cells were electroporated using an exponential wave pulse of 250 V, 300 μF, and 1000 Ω. Cells electroporated with GAPDH siRNA (dark green) showed an 88% reduction of the GAPDH transcript as compared with negative control cells. Values were normalized to negative control (light green bars at 0% gene silencing).
FIGURE 6
FIGURE 6
Electroporation of Neuro-2a cells using an exponential waveform pulse of 250 V, 350 μF, and 1000 Ω. Cells were assayed 24 h after transfection. A: Cells analyzed by flow cytometry. Nonelectroporated negative control cells (top) and electroporated cells (bottom) were treated with fluorescent TC siRNA in electroporation buffer. We used 4 × 10 cells/mL in these experiments. B: Cells analyzed by microscopy. Cells were electroporated with pEGFP plasmid DNA. Top: Bright field image of Neuro-2A cells. Bottom: fluorescent image. We used 2 × 10 cells/mL in these electroporations.
FIGURE 7
FIGURE 7
Luciferase activity of SK-N-SH cells electroporated with pCMVI-Luc using the preset protocol Opt Mini 96/Sqr, Exponential. Three square-wave well sets were used to test differing voltages with a pulse duration of 20 msec (dark green), while three exponential well sets were used to test capacitances at constant voltage (250 V) and resistance (1000 Ω) (light green). Two cell densities were tested: 1 × 10 cells/mL and 3 × 10 cells/mL (only 3 × 10 cells/mL data are shown here). *, The condition providing the highest luciferase activity. Cap, capacitance; RLU, relative light units.

References

    1. Shigekawa K, Dower WJ. Electroporation of eukaryotes and prokaryotes: A general approach to the introduction of macromolecules into cells. Biotechniques. 1988;6:742–751. - PubMed
    1. Tsong TY. Electroporation of cell membranes. Biophys J. 1991;60:297–306. - PMC - PubMed
    1. Rols M-P, Golzio M, Delteil C, Teissie J. In vitro delivery of drugs and other molecules to cells. In: Jaroszeski MJ, Heller R, Gilbert R, editors. Methods in Molecular Medicine. Vol. 37. Totowa, NJ: Humana Press; 2000. pp. 83–97. - PubMed
    1. Rols MP. Electropermeabilization: A physical method for the delivery of therapeutic molecules into cells. Biochim Biophys Acta. 2006;1758:423–428. - PubMed
    1. Rols M-P, Teissié J. Electropermeabilization of mammalian cells to macromolecules: Control by pulse duration. Biophys J. 1998;75:1415–1423. - PMC - PubMed

Substances

LinkOut - more resources