. 2009 Apr 1;513(4):399-416.
doi: 10.1002/cne.21979.

Cloning and immunoreactivity of the 5-HT 1Mac and 5-HT 2Mac receptors in the central nervous system of the freshwater prawn Macrobrachium rosenbergii

Affiliations

Cloning and immunoreactivity of the 5-HT 1Mac and 5-HT 2Mac receptors in the central nervous system of the freshwater prawn Macrobrachium rosenbergii

Nietzell Vázquez-Acevedo et al. J Comp Neurol. .

Abstract

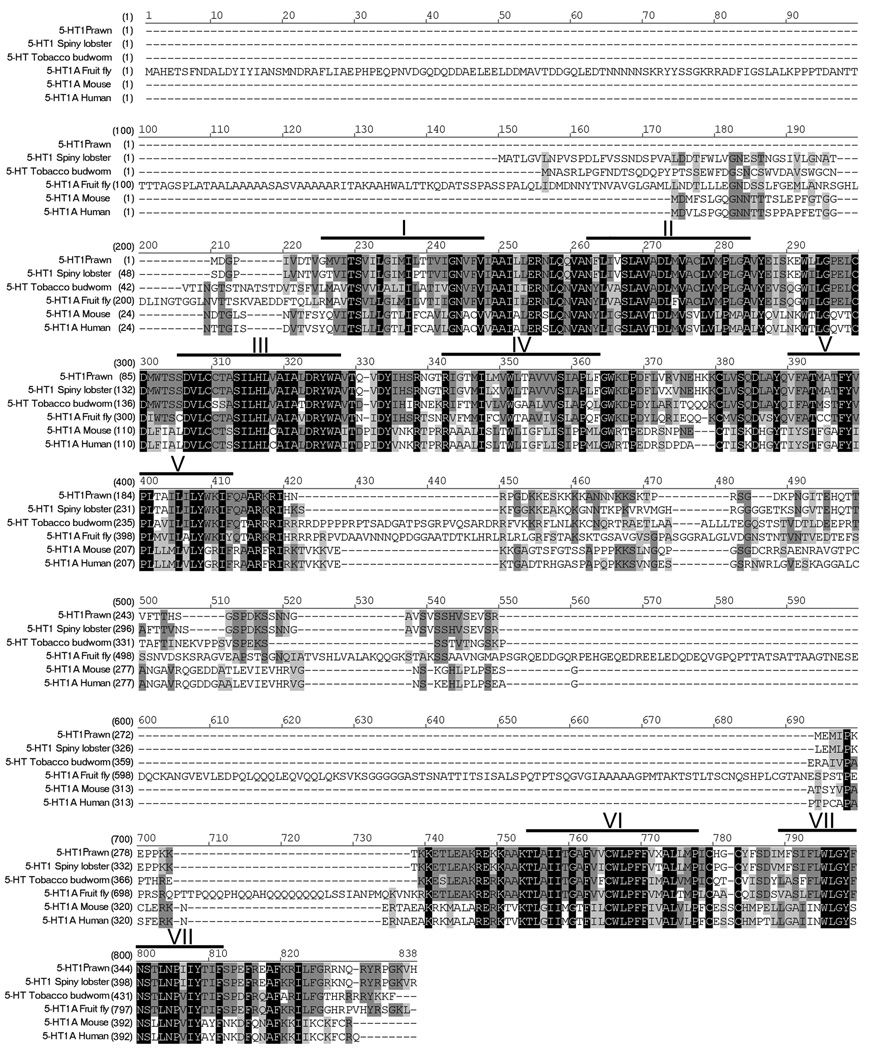
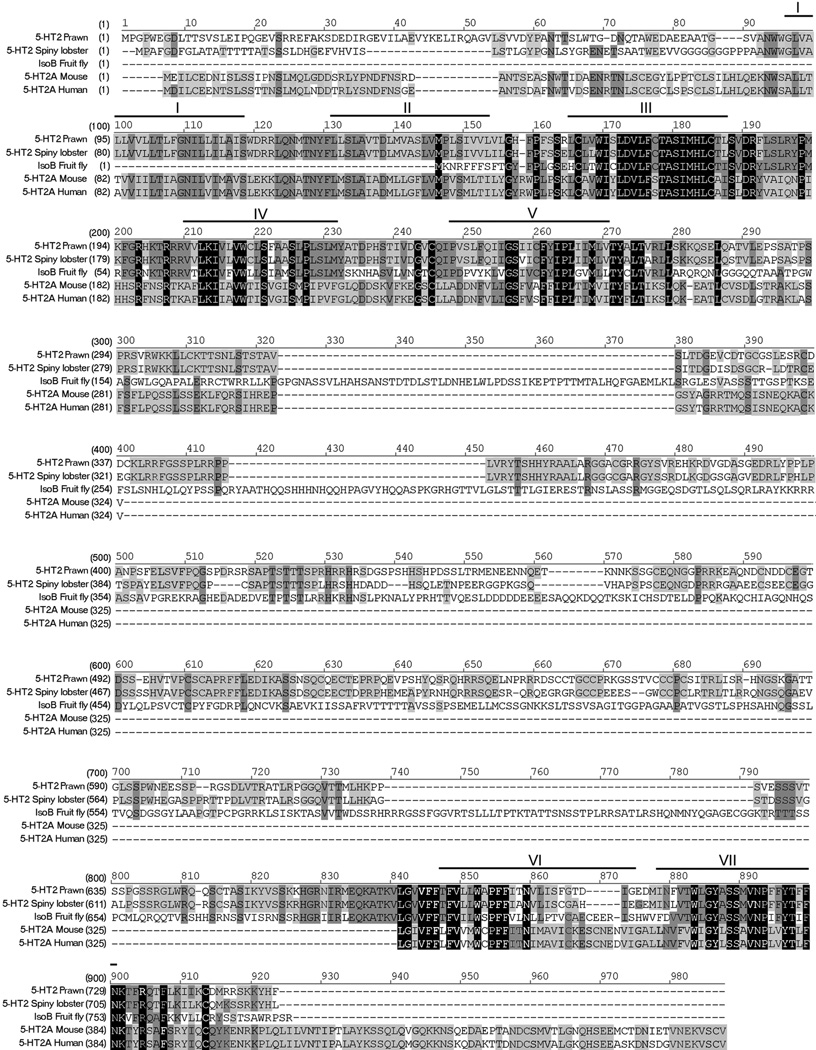
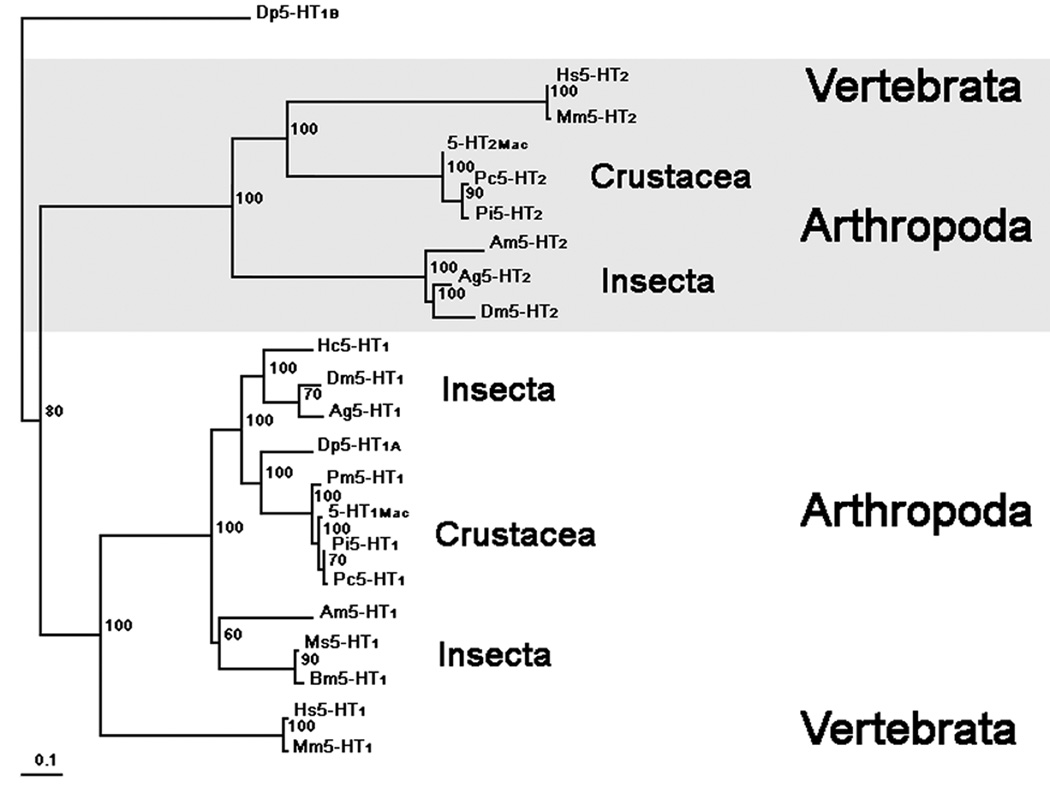
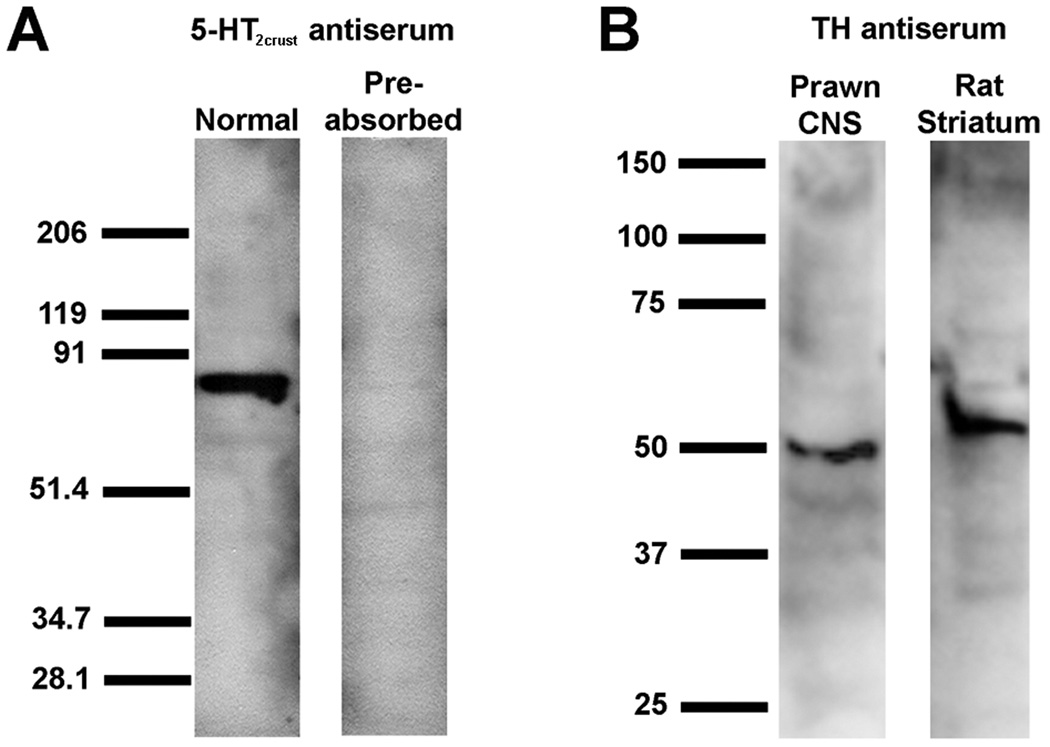
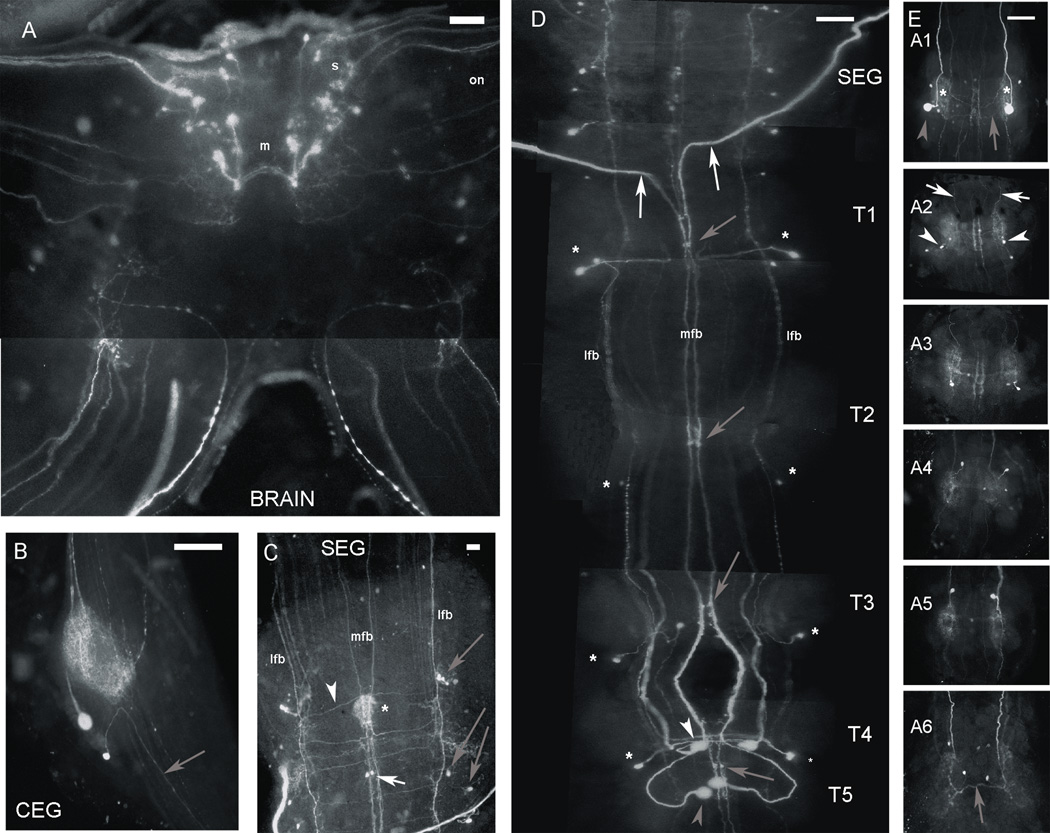
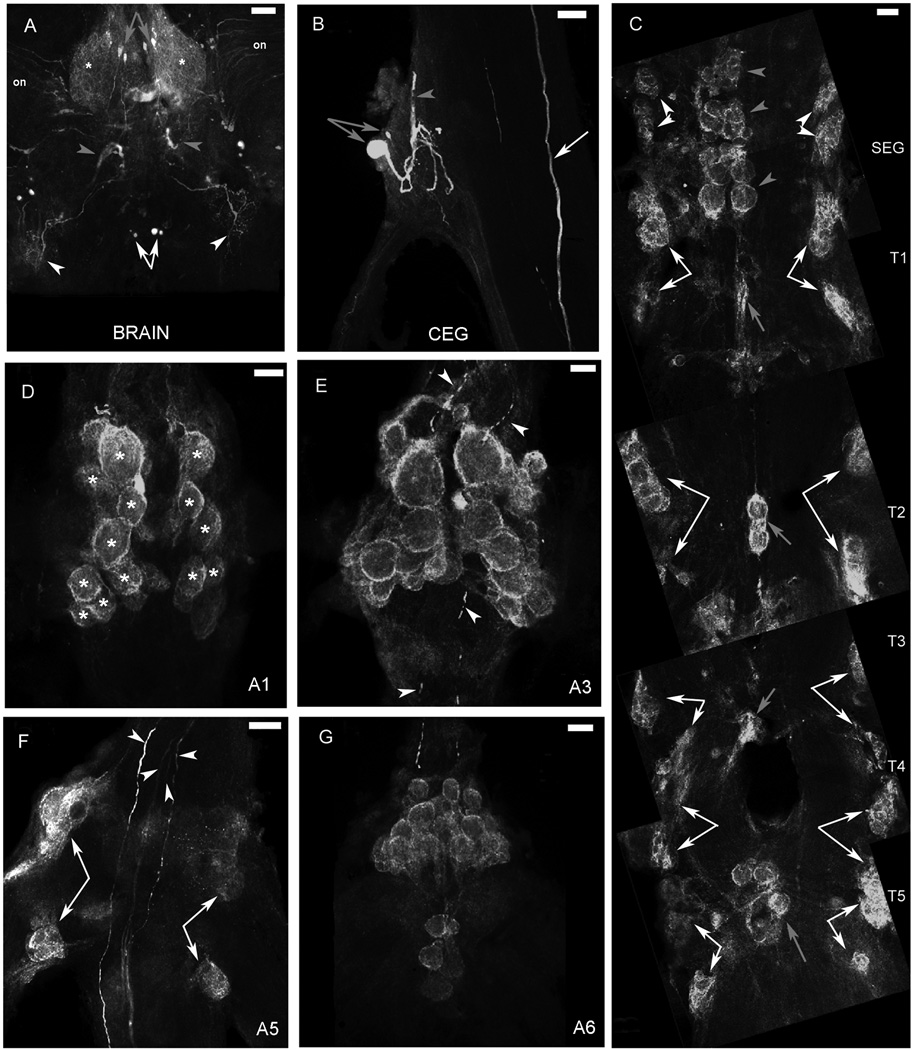
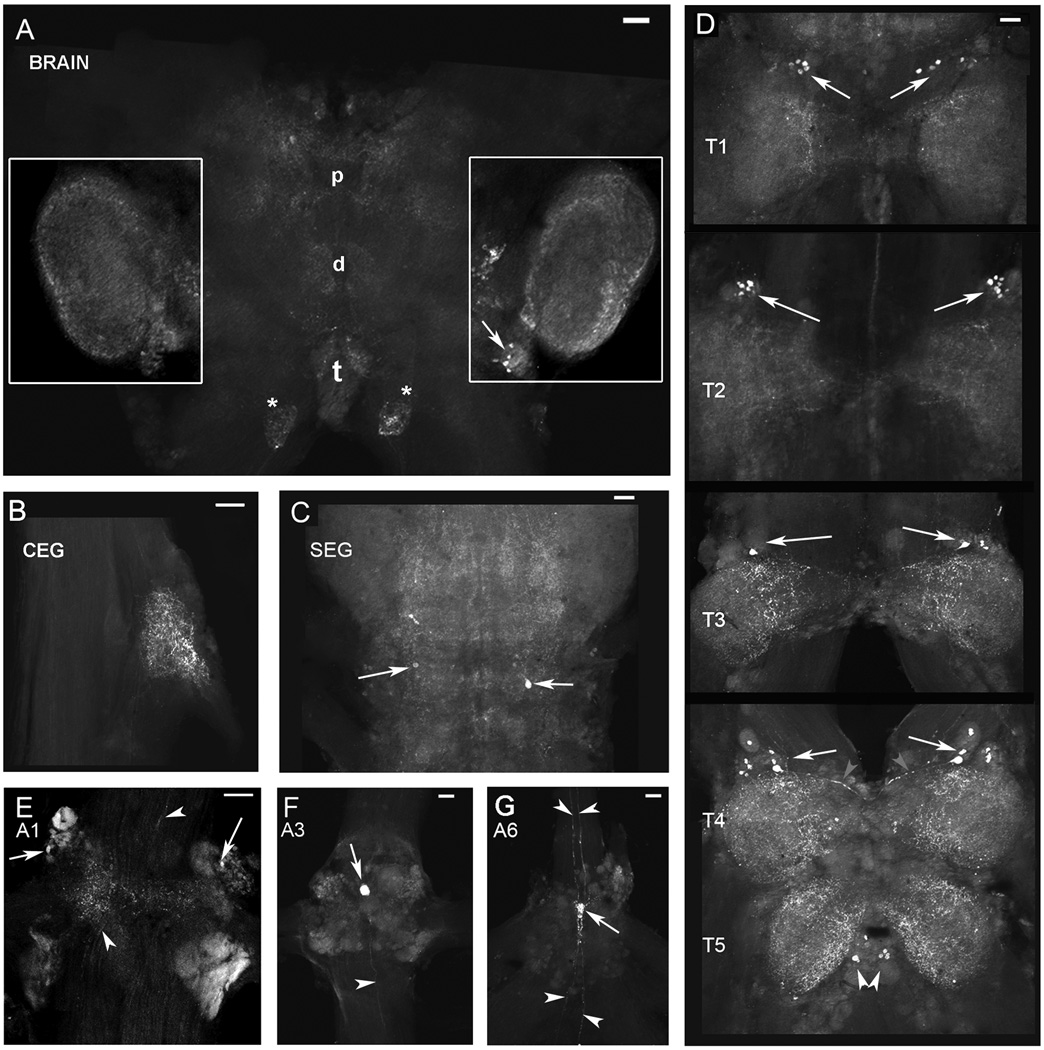
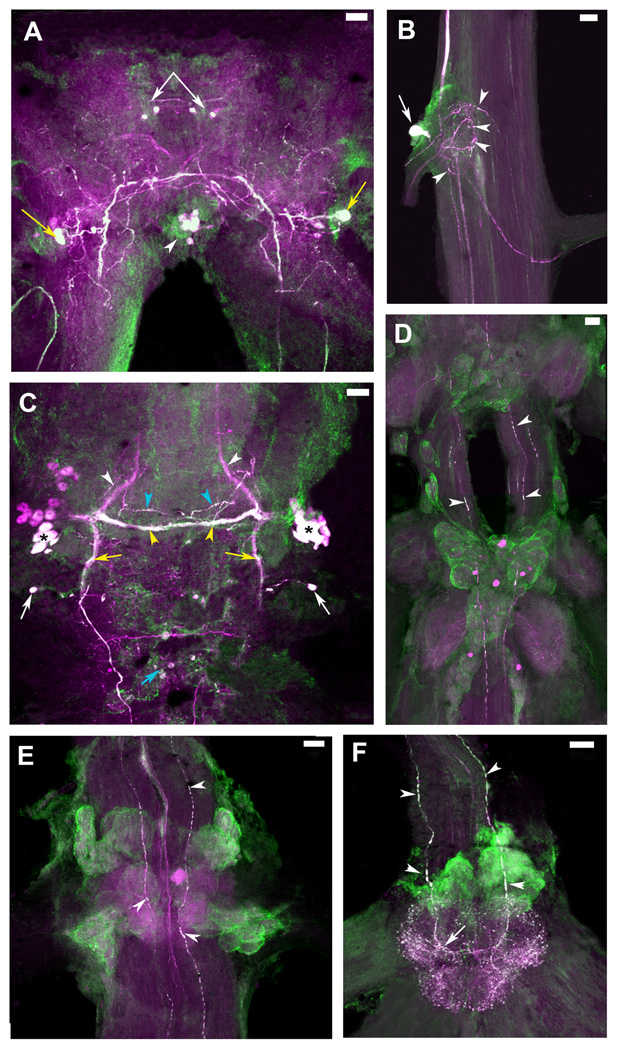
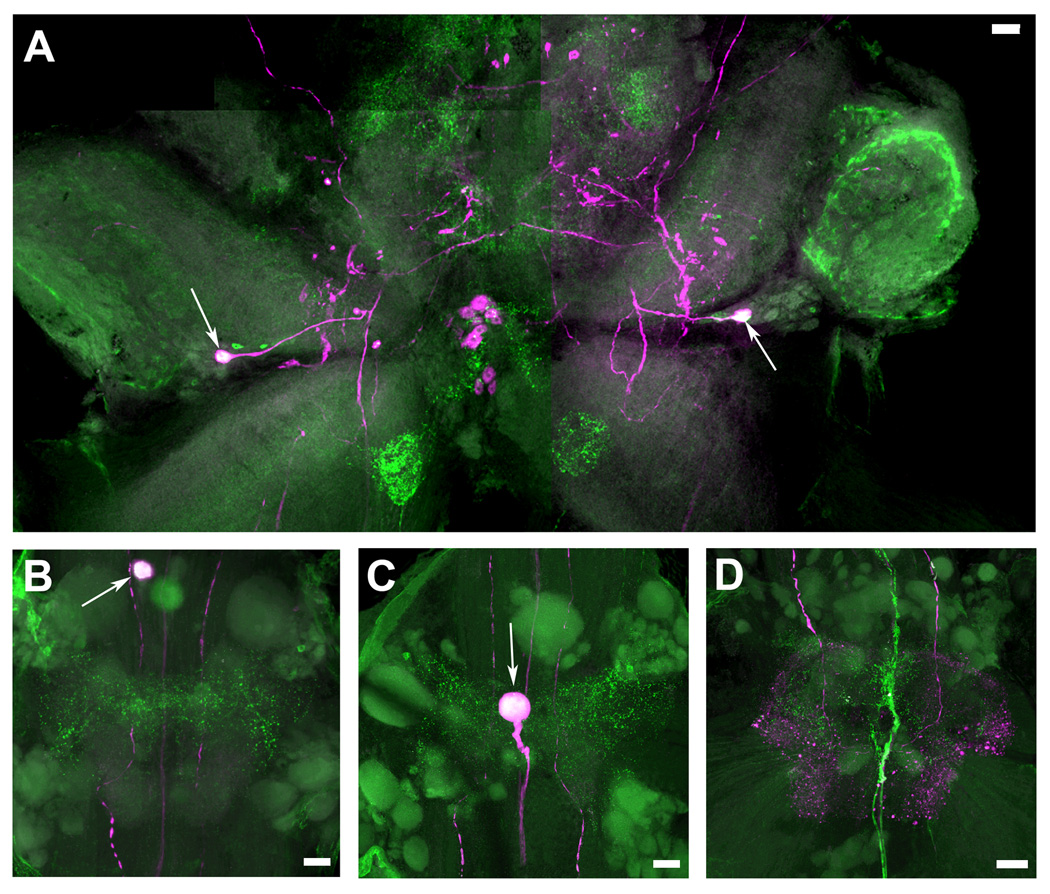
Biogenic amines are implicated in several mental disorders, many of which involve social interactions. Simple model systems, such as crustaceans, are often more amenable than vertebrates for studying mechanisms underlying behaviors. Although various cellular responses of biogenic amines have been characterized in crustaceans, the mechanisms linking these molecules to behavior remain largely unknown. Observed effects of serotonin receptor agonists and antagonists in abdomen posture, escape responses, and fighting have led to the suggestion that biogenic amine receptors may play a role in modulating interactive behaviors. As a first step in understanding this potential role of such receptors, we have cloned and fully sequenced two serotonin receptors, 5-HT(1Mac) and 5-HT(2Mac), from the CNS of the freshwater prawn Macrobrachium rosenbergii and have mapped their CNS immunohistochemical distribution. 5-HT(1Mac) was found primarily on the membranes of subsets of cells in all CNS ganglia, in fibers that traverse all CNS regions, and in the cytoplasm of a small number of cells in the brain and circum- and subesophageal ganglia (SEG), most of which also appear to contain dopamine. The pattern of 5-HT(2Mac) immunoreactivity was found to differ significantly; it was found mostly in the central neuropil area of all ganglia, in glomeruli of the brain's olfactory lobes, and in the cytoplasm of a small number of neurons in the SEG, thoracic, and some abdominal ganglia. The observed differences in terms of localization, distribution within cells, and intensity of immunoreactive staining throughout the prawn's CNS suggest that these receptors are likely to play different roles.


Figures

Figure 1
Figure 1. Alignment of 5-HT1Mac receptor
The amino acid sequence of 5-HT1Mac receptor is aligned with the most highly homologous proteins found in each order. Heavy lines and roman numerals above the sequence indicate transmembrane regions 1 through 7. Black boxes with white letters represent areas of identical regions, dark gray boxes with black letters represent conserved regions, and light gray boxes with black letters represent blocks of similar regions. Accession numbers are: prawn, EU363466; lobster (Decapoda), AAS18607; tobacco budworm (Lepidoptera), CAA64863; fruit fly (Diptera), NP_476802; mouse (Rodentia), NP_032334; human (Primate), NP_000515.
Figure 2
Figure 2. Alignment of 5-HT2Mac receptor
The amino acid sequence of 5-HT2Mac receptor is aligned with the most highly homologous proteins found in each. Heavy lines and roman numerals above the sequence indicate transmembrane regions 1 through 7. Black boxes with white letters represent areas of identical regions, dark gray boxes with black letters represent conserved regions, and light gray boxes with black letters represent blocks of similar regions. Accession numbers are: prawn, EF033662; lobster, AAS57919; fruit fly, NP_649806; mouse, NP_766400; human, NP_000612.
Figure 3
Figure 3. Phylogenetic tree
Evolutionary relationship of the prawn’s 5-HT1Mac and 5-HT2Mac receptors with 5-HT receptors of other species showing highest homology. The phylogenetic tree was generated using default parameters and 10,000 iterations of the maximum likelihood algorithm implemented in the program TREE-PUZZLE (Schmidt et al., 2002; http://www.tree-puzzle.de). The initial multiple alignment was done using ClustalX (Jeanmougin et al., 1998; Thompson et al., 1997) with default parameters. All sequences were timed to include only the core part of the proteins along with additional gaps removed manually in GeneDoc (Nicholas et al., 1997) prior to tree construction. Numbers at branches represent bootstrap values for 10,000 iterations. Branch-length scale bar represents 0.1 amino acid substitutions per site. The graphical output was generated using Treeview (Page, 1996). The name, abbreviation and accession number for all species used in this analysis are: Macrobrachium rosenbergii, 5-HT1Mac, EU363466; Daphnia pulex, Dp5HTR1B, jgi|Dappu1|23299|gw1.13.237.1; Daphnia pulex, Dp5HTR1A, jgi|Dappu1|42951|e_gw1.5.342.1; Penaeus monodon, Pm5HTR1, AAV48573.1; Heliothis virescens, Hv5HTR1, CAA64863.1; Panulirus interruptus, Pi5HTR1,AAS18607.1; Procambarus clarkii, Pc5HTR1, ABX10973.1; Apis mellifera, Am5HTR1, XP_393915.3; Anopheles gambiae, Ag5HTR1, XP_308623.4; Manduca sexta, Ms5HTR1A, ABI33826.1; Manduca sexta, Ms5HTR1B, ABI33827.1; Drosophila melanogaster, Dm5HTR1, NP_476802; Mus musculus, Mm5HTR1, NP_032334; Homo sapiens, Hs5HTR1A, NP_000515; Macrobrachium rosenbergii, 5-HT2Mac, EF033662; Panulirus interruptus, Pi5HTR2, AAS57919; Drosophila melanogaster, Dm5HTR2, NP_649806; Apis mellifera, Am5HTR2, XP_394798; Anopheles gambiae, Ag5HTR2, XP_307953; Procambarus clarkii, Pc5HTR2, ABX10972.1; Mus musculus, Mm5HTR2, NP_766400; Homo sapiens, Hs5HTR1A, NP_000612.
Figure 4
Figure 4. Anti-5-HT2crust and Anti-TH antibody specificity
A: A representative Western blot experiment showing that the anti-5-HT2crust antibody recognizes the 5-HT2Mac receptor in the prawn nervous system. The blots containing a protein extract from the nervous system of the prawn were probed with anti-5-HT2crust or the same antibody preabsorbed with the peptide antigen used to generate the antibody. Molecular weight markers (numbers to the left) are in kD. The antibody produces a signal of the predicted size of the protein. This signal is lost when the antibody is first preabsorbed. B: A representative Western blot experiment showing that the anti-TH antibody recognizes the TH in the prawn nervous system. Blots containing a protein extract from the nervous system of the prawn and a protein extract from rat striatum (positive control) were probed with anti-TH. Molecular weight markers (numbers to the left) are in kD. The antibody produces a signal of the predicted size of the protein in both lanes.
Figure 5
Figure 5. Serotonin immunoreactivity in the CNS of the prawn
A: View of the brain, containing paired clusters of medium (m: 50–80 µm) and small (s: 20–50 µm) 5-HT immunoreactive (ir) cells located near the midline. The small-sized 5-HT ir cells tended to cluster near the base of the optic stalks, sending axons through the optic nerve (on). B: View of the circumesophageal ganglion (CEG), containing a pair of 5-HT ir cells, both of which sent their axons anteriorly towards the brain (gray arrow), and an extensive network of 5-HT ir terminal arborizations. C: View of the subesophageal ganglion (SEG), containing small bilaterally paired 5-HT ir cells found along the paths of immunoreactive midline and lateral fiber bundles (MFB and LFB, respectively). One pair of cells was consistently found along the MFB (white arrow), while at least three or four cells could be seen along each LFB (gray arrows). Thin 5-HT ir fibers could also be seen bridging the fibers of the LFB and MFB (white arrowhead). An area of dense 5-HT ir terminal arborizations (*) was also consistently labeled in the midline towards the center of the ganglion. D: View of the thoracic (T) ganglia, the first four containing at least one bilateral pair (in some cases two) of small 5-HT ir neurons with cell bodies placed laterally and axons projecting towards the midline (*). The fourth and fifth thoracic ganglia (T4–T5) also had pairs of large neurons, one in the midline (T5; gray arrowhead), the other halfway between the midline and the lateral edge of the ganglion (T4; white arrowhead). The axons of the latter pair of neurons projected horizontally for a short span and then anteriorly between the MFB and LFB. Cell bodies of axons comprising the MFB included two pairs of large 5-HT ir neurons: the T5 large midline neurons (gray arrowhead) and the two larger neurons of the first abdominal ganglion (gray arrowhead in Fig. 5E:A1). At least one pair of thick 5-HT ir fibers that form part of the MFB (white arrows) exited the ventral nerve cord through one of the SEG nerve roots. Two pairs of small 5-HT ir neurons were also consistently found along the MFB of the thoracic ganglia (gray arrows). E: Views of the six abdominal ganglia, each containing at least two pairs of small cells (white arrowheads), with fibers that turn anteriorly (white arrows) and branches that crossed the midline (gray arrows), with a neuropil region located laterally in each hemiganglion (*). The A1 ganglion appeared different only in that one pair of these 5-HT ir neurons was larger in size (gray arrowhead).All images shown were obtained from the ventral nerve cord of a male blue clawed prawn, except C, which was obtained from a male small clawed prawn. Images were obtained with a Zeiss Axioskop fluorescence microscope. (Scale bar = 250 µm for all images, except C, where it represents 100 µm).
Figure 6
Figure 6. 5-HT1Mac immunoreactivity in the CNS of the prawn
A: View of the brain, in which 5-HT1Mac immunoreactivity (ir) was observed as diffuse punctate staining, in the neuropil of the protocerebrum (*), within a group of 4–8 small-sized cells in the protocerebrum (gray arrows), a group of 4–8 medium-sized cells in the tritocerebrum (white arrows), in fibers in the optic nerves (on), within the deutocerebrum (gray arrowheads) and coming in through the connectives from the circumesophageal ganglia (CEG) (white arrowheads). B: View of the CEG, showing 5-HT1Mac ir within two cells (gray arrows), the largest of which sends its axon towards the brain (gray arrowhead), and in a fiber traversing the connective (white arrow). C: Ventral view of the subesophageal ganglion (SEG) and thoracic (T) ganglia, showing 5-HT1Mac ir on the membranes of SEG cells arranged in groups located on the lateralmost edges of the ganglion (white arrowheads) and along its midline (gray arrowheads), and on the membranes of cells located at the center of each thoracic ganglion (gray arrows), along with 4 clusters of medium- to large-sized cells, arranged as the wings of a butterfly, located towards the lateralmost edges of each ganglion (white arrows). The first (T1) and fifth (T5) thoracic ganglia had the larger of the centrally located clusters. D: Ventral view of the first abdominal ganglion (A1) showing 5-HT1Mac ir on the membranes of large-sized cells (*) arranged in clusters located at both sides of the midline. E: Ventral view of the third abdominal ganglion (A3) showing a pattern of 5-HT1Mac ir similar to that observed for A1. 5-HT1Mac ir could also be observed in centrally located fibers that traversed the ganglia along its connectives (white arrowheads). F: Dorsal view of the fifth abdominal ganglion (A5) showing 5-HT1Mac ir along 4 clusters of medium- to large-sized cells, located laterally and arranged as the wings of a butterfly (white arrows), and in 4 centrally located fibers that traversed the ganglia along its connectives (white arrowheads). G: Ventral view of the sixth abdominal ganglion (A6) showing 5-HT1Mac ir on the membranes of cells arranged in clusters (white arrows), following a pattern similar to that described for A1 and A3. All images shown were obtained from the ventral nerve cord of a male blue clawed prawn. Images A, B and F are each an individual frame or optical slice of sets of confocal stacks. Images C, D, E and G are each a composite of optical slices of sets of confocal stacks spanning the ventral aspect of the full dorsal-ventral axis of the ganglia. The fluorescence has been digitally brightened, and several pieces of surface debris have been digitally removed. (Scale bars = 250 µm).
Figure 7
Figure 7. 5-HT2Mac immunoreactivity in the CNS of the prawn
A: View of the brain, showing 5-HT2Mac immunoreactivity (ir) as very fine punctate staining throughout the neuropil of the centralmost regions of the proto- (p), deuto- (d) and tritocerebrum (t), surrounding the glomeruli of the olfactory lobes (white boxes), in a few small-sized cells medial and inferior to the olfactory lobes (white arrows), and in fibers and terminal arborizations (*) entering through the connectives near the tritocerebrum. B: View of the circumesophageal ganglion (CEG), showing 5-HT2Mac ir as punctate staining in the neuropil. C: Ventral view of the subesophageal ganglion (SEG), showing 5-HT2Mac ir as very fine punctate staining throughout the neuropil, and in a few small-sized cells and fibers placed laterally (white arrows). D: Ventral view of the thoracic (T) ganglia, showing 5-HT2Mac ir in groups of 2–8 small-sized cells located superolaterally on each side of the T1–T4 ganglia (white arrows) and inferomedially at T5 (white arrowheads), in the axons (gray arrowheads) of some neurons forming these clusters (e.g., see T4), and in the neuropil of all five thoracic ganglia, with a higher intensity of staining observed in T4 and T5. E: Dorsal view of the first abdominal ganglion (A1), showing 5-HT2Mac ir in a pair of small-sized cells located bilaterally in the superolateral aspect of the ganglion (white arrows), in the neuropil, and in fibers traversing the ganglion along its connectives (white arrowheads). F. Dorsal view of the third abdominal ganglion (A3), showing 5-HT2Mac ir in a single medium-sized cell (white arrow) in the midline between the two upper quadrants of the ganglion and in fibers traversing the ganglion along its connectives (white arrowhead). G: Dorsal view of the sixth abdominal ganglion (A6), showing 5-HT2Mac ir in a single medium-sized cell (white arrow) in the midline between the two upper quadrants of the ganglion, and in fibers traversing the ganglion along its connectives and nerve roots (white arrowheads). All images shown were obtained from the ventral nerve cord of a male blue clawed prawn. Images A, E, F and G are each an individual frame or optical slice of sets of confocal stacks. Images B, C and D are each a composite of optical slices of sets of confocal stacks spanning the full dorsal-ventral axis of the ganglia. The fluorescence has been digitally brightened, and several pieces of surface debris have been digitally removed. (Scale bars = 100 µm).
Figure 8
Figure 8. Colocalization of 5-HT1Mac and TH immunoreactivity in the CNS of the prawn
5-HT1Mac immunoreactivity (ir) shown in green and Tyrosine Hydroxylase (TH) ir shown in magenta. TH ir is taken to represent dopamine (DA)-containing cells (see Materials & Methods). Cells and fibers showing immunoreactivity to both 5-HT1Mac and TH appear white. A: View of the brain, showing colocalization of both 5-HT1Mac and TH/DA in a group of four small-sized cells in the protocerebrum (white arrows), a pair of large- to medium-sized cells in the deutocerebrum (yellow arrows), and a cluster of 4–8 medium-sized cells in the tritocerebrum (white arrowheads). B: View of the circumesophageal ganglion (CEG), showing colocalization for both 5-HT1Mac and TH/DA in a large-sized cell (white arrow) that sends its axon towards the brain, as well as in terminal arborizations (white arrowheads) within the neuropil of the ganglion. C: View of the subesophageal ganglion (SEG), showing 5-HT1Mac and TH/DA colocalization in some (*), but not all, of the medium-sized cells within the bilateral clusters of the ganglion, in the fascicles of axons going to the contralateral (yellow arrowheads) side of the ganglion (but not in those going towards the CEG; white arrowheads), within longitudinal fibers communicating the SEG with the lower ganglia (yellow arrows), in some, but not all, of the horizontally-oriented fibers forming a ladder-like pattern (blue arrowheads), and in the small-sized cells on the edges of the ganglion (white arrows), inferior to the bilateral clustered cells, as well as in the centrally located cells (blue arrow) between the SEG and the first thoracic ganglion (T1). D: View of T3-T4, showing 5-HT1Mac and TH/DA colocalization only in the longitudinal fibers that traverse the ganglia (white arrowheads). E: View of the first abdominal ganglion (A1), showing 5-HT1Mac and TH/DA colocalization in the longitudinal fibers that traverse the ganglia (white arrowheads) and rather sparsely on the terminal arborizations within the neuropil. F: View of the sixth abdominal ganglion (A6), showing 5-HT1Mac and TH/DA colocalization in the expansive terminal arborization that forms at the end of the longitudinal fibers entering through the connective. All images shown were obtained from the ventral nerve cord of a male blue clawed prawn. All images are composites of optical slices of sets of confocal stacks spanning the full dorsal-ventral axis of the ganglia. The fluorescence has been digitally brightened, and several pieces of surface debris have been digitally removed. (Scale bars = 100 µm).
Figure 9
Figure 9. Colocalization of 5-HT2Mac and TH immunoreactivity in the CNS of the prawn
5-HT2Mac immunoreactivity (ir) shown in green and Tyrosine Hydroxylase (TH) ir shown in magenta. TH ir is taken to represent dopamine (DA)-containing cells (see Materials & Methods). Cells and fibers showing immunoreactivity to both 5-HT2Mac and TH appear white. A: View of the brain, showing colocalization of both 5-HT2Mac and TH/DA only in the somas of a pair of medium-sized cells in the deutocerebrum (white arrows). B: View of the first abdominal ganglion (A1) showing colocalization of both 5-HT2Mac and TH/DA only at the soma of a single cell located at the midline (white arrow). C: View of the third abdominal ganglion (A3) showing colocalization of both 5-HT2Mac and TH/DA only at the soma of a single cell located at the midline (white arrows. D: View of the sixth abdominal ganglion (A6) showing there is no colocalization of 5-HT2Mac and DA (no white or overlapping staining). All images shown were obtained from the ventral nerve cord of a male blue clawed prawn. All images are composites of optical slices of sets of confocal stacks spanning the full dorsal-ventral axis of the ganglia. The fluorescence has been digitally brightened, and several pieces of surface debris have been digitally removed. (Scale bars = 100 µm).

Similar articles

Cited by

References

    1. Adams CF, Liley NR, Gorzalka BB. PCPA increases aggression in male firemouth cichlids. Pharmacology. 1996;53(5):328–330. - PubMed
    1. Albert FW, Shchepina O, Winter C, Römpler H, Teupser D, Palme R, Ceglarek U, Kratzsch J, Sohr R, Trut LN, Thiery J, Morgenstern R, Plyusnina IZ, Schöneberg T, Pääbo S. Phenotypic differences in behavior, physiology and neurochemistry between rats selected for tameness and for defensive aggression towards humans. Horm Behav. 2008;53(3):413–421. - PubMed
    1. Alvarez-Alvarado R, Porras Villalobos MG, Calderón Rosete G, Rodríguez Sosa L, Aréchiga H. Dopaminergic modulation of neurosecretory cells in the crayfish. Cell Mol Neurobio. 2005;25(2):345–370. - PMC - PubMed
    1. Ayali A, Harris-Warrick RM. Monoamine control of the pacemaker kernel and cycle frequency in the lobster pyloric network. J Neurosci. 1999;19(15):6712–6722. - PMC - PubMed
    1. Barbas D, Zappulla JP, Angers S, Bouvier M. Functional characterization of a novel serotonin receptor (5-HTap2) expressed in the CNS of Aplysia californica. J Neurochem. 2002;80:335–345. - PubMed

Publication types