

A low interleukin-2 receptor signaling threshold supports the development and homeostasis of T regulatory cells
- PMID: 19185518
- PMCID: PMC2962446
- DOI: 10.1016/j.immuni.2008.11.014
A low interleukin-2 receptor signaling threshold supports the development and homeostasis of T regulatory cells
Abstract
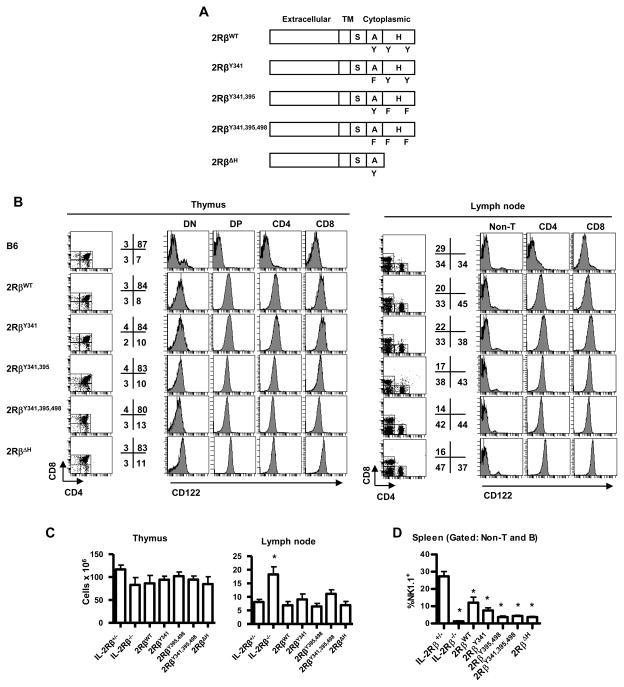
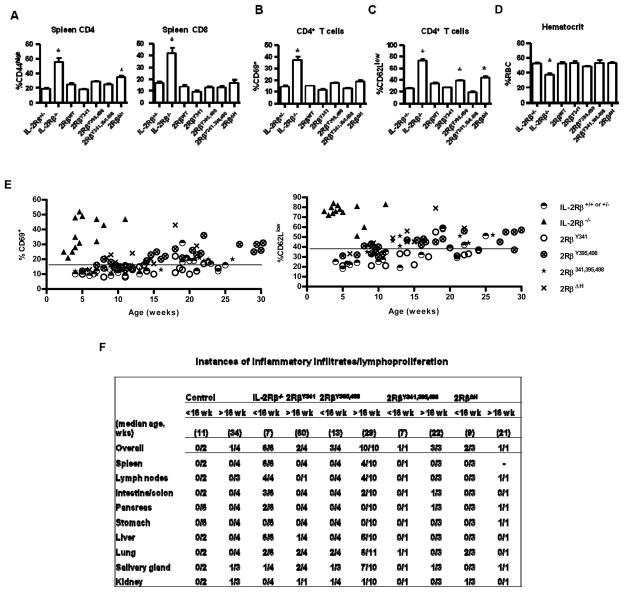
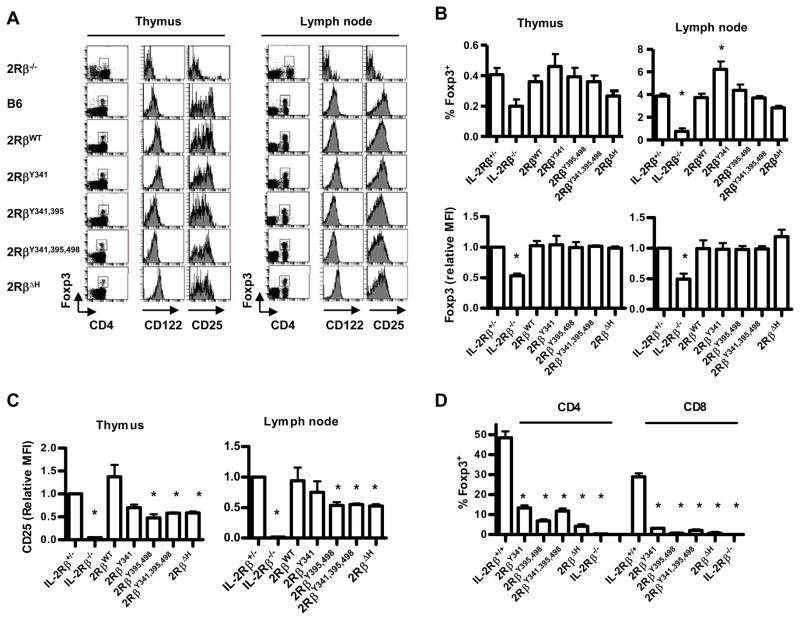
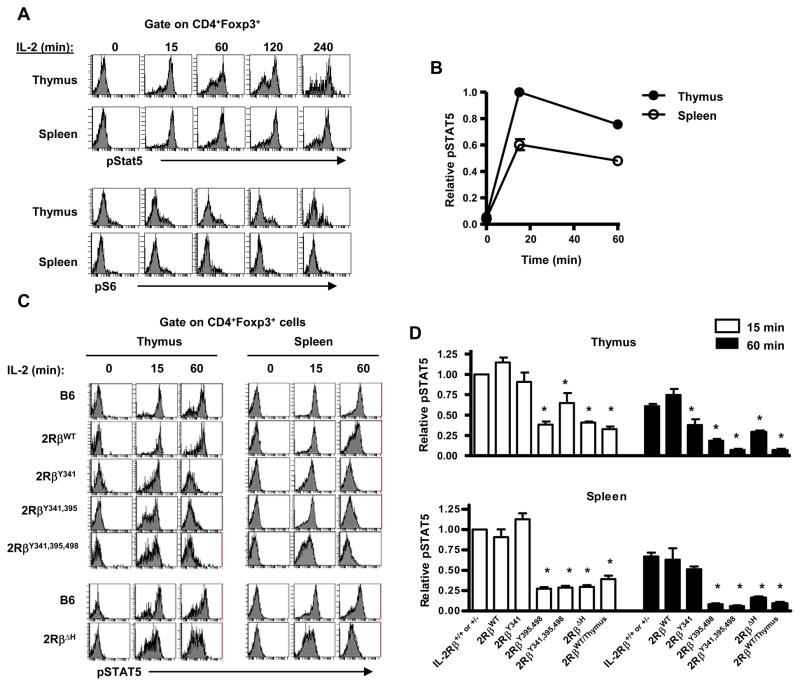
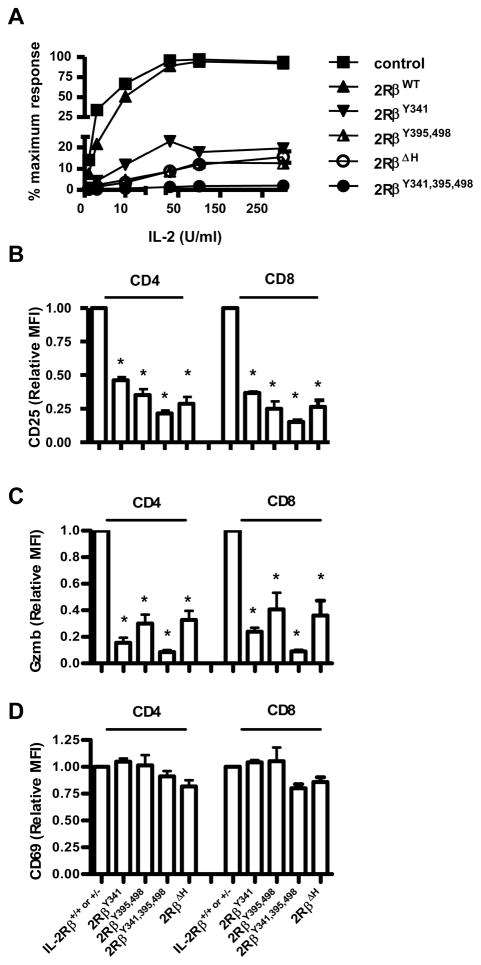
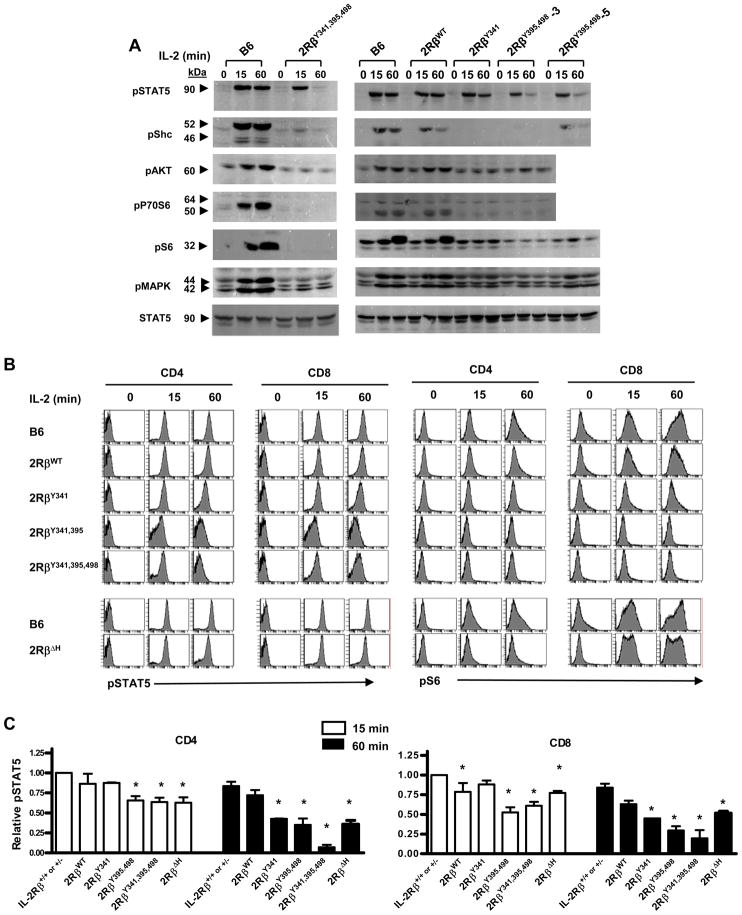
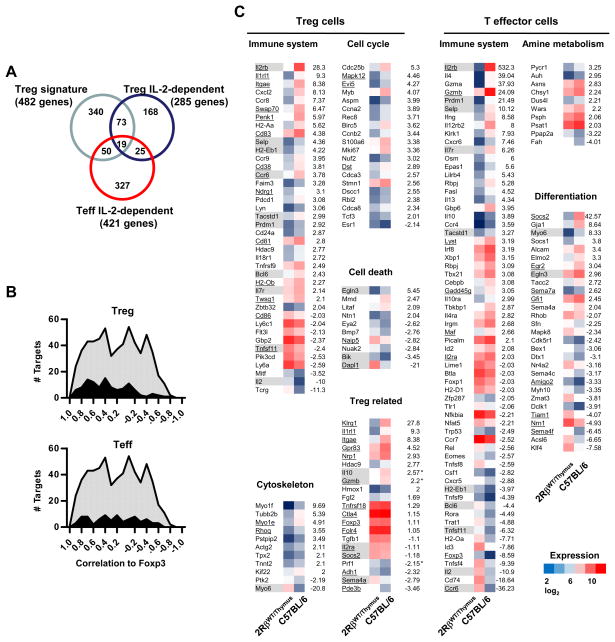
Interleukin-2 receptor (IL-2R) signaling is essential for T regulatory (Treg) cell development and homeostasis. Here, we show that expression of IL-2Rbeta chains that lack tyrosine residues important for the association of the adaptor Shc and the transcription factor STAT5 in IL-2Rbeta-deficient mice resulted in production of a normal proportion of natural Treg cells that suppressed severe autoimmunity related with deficiency in IL-2 or IL-2R. These mutant IL-2Rbeta chains supported suboptimal and transient STAT5 activation that upregulate the transcription factor Foxp3 to normal amounts in natural, but not induced, Treg cells. Nevertheless, gene expression profiling revealed many targets in peripheral natural Treg cells that were IL-2 dependent and a substantial overlap between the Treg cell IL-2-dependent gene program and the Treg cell transcriptional signature. Collectively, these findings demonstrate that a critical, and perhaps minor, subset of IL-2-dependent targets is indexed to a low IL-2R signaling threshold and that a substantial proportion of the Treg cell gene program is regulated by IL-2.
Figures
Similar articles
-
IL-2Rbeta links IL-2R signaling with Foxp3 expression.Eur J Immunol. 2007 Jul;37(7):1817-26. doi: 10.1002/eji.200737101. Eur J Immunol. 2007. PMID: 17559173
-
IL-2 receptor beta-dependent STAT5 activation is required for the development of Foxp3+ regulatory T cells.J Immunol. 2007 Jan 1;178(1):280-90. doi: 10.4049/jimmunol.178.1.280. J Immunol. 2007. PMID: 17182565
-
IL-2R signaling is essential for functional maturation of regulatory T cells during thymic development.J Immunol. 2013 Feb 15;190(4):1567-75. doi: 10.4049/jimmunol.1201218. Epub 2013 Jan 11. J Immunol. 2013. PMID: 23315074 Free PMC article.
-
A function for IL-7R for CD4+CD25+Foxp3+ T regulatory cells.J Immunol. 2008 Jul 1;181(1):225-34. doi: 10.4049/jimmunol.181.1.225. J Immunol. 2008. PMID: 18566388 Free PMC article.
-
T-cell tolerance and the multi-functional role of IL-2R signaling in T-regulatory cells.Immunol Rev. 2011 May;241(1):63-76. doi: 10.1111/j.1600-065X.2011.01004.x. Immunol Rev. 2011. PMID: 21488890 Free PMC article. Review.
Cited by
-
Reduced IL-2 response from peripheral blood mononuclear cells exposed to bacteria at 6 months of age is associated with elevated total-IgE and allergic rhinitis during the first 7 years of life.EBioMedicine. 2019 May;43:587-593. doi: 10.1016/j.ebiom.2019.04.047. Epub 2019 May 2. EBioMedicine. 2019. PMID: 31056472 Free PMC article.
-
Functional Defects of Treg Cells: New Targets in Rheumatic Diseases, Including Ankylosing Spondylitis.Curr Rheumatol Rep. 2018 Apr 16;20(5):30. doi: 10.1007/s11926-018-0729-1. Curr Rheumatol Rep. 2018. PMID: 29663162 Review.
-
Efficient IL-2R signaling differentially affects the stability, function, and composition of the regulatory T-cell pool.Cell Mol Immunol. 2021 Feb;18(2):398-414. doi: 10.1038/s41423-020-00599-z. Epub 2021 Jan 6. Cell Mol Immunol. 2021. PMID: 33408345 Free PMC article.
-
Low-Dose IL-2 in the Treatment of Lupus.Curr Rheumatol Rep. 2016 Nov;18(11):68. doi: 10.1007/s11926-016-0617-5. Curr Rheumatol Rep. 2016. PMID: 27734211 Review.
-
Ectonucleotidase CD38 demarcates regulatory, memory-like CD8+ T cells with IFN-γ-mediated suppressor activities.PLoS One. 2012;7(9):e45234. doi: 10.1371/journal.pone.0045234. Epub 2012 Sep 17. PLoS One. 2012. PMID: 23028866 Free PMC article.
References
-
- Almeida AR, Legrand N, Papiernik M, Freitas AA. Homeostasis of peripheral CD4+ T cells: IL-2R α and IL-2 shape a population of regulatory cells that controls CD4+ T cell numbers. J Immunol. 2002;169:4850–4860. - PubMed
-
- Antov A, Yang L, Vig M, Baltimore D, Van Parijs L. Essential role for STAT5 signaling in CD25+CD4+ regulatory T cell homeostasis and the maintenance of self-tolerance. J Immunol. 2003;171:3435–3441. - PubMed
-
- Ascherman DP, Migone TS, Friedmann MC, Leonard WJ. Interleukin-2 (IL-2)-mediated induction of the IL-2 receptor α chain gene. Critical role of two functionally redundant tyrosine residues in the IL-2 receptor beta chain cytoplasmic domain and suggestion that these residues mediate more than Stat5 activation. JBiol Chem. 1997;272:8704–8709. - PubMed
Publication types
MeSH terms
Substances
Associated data
- Actions
Grants and funding
LinkOut - more resources
Full Text Sources
Other Literature Sources
Molecular Biology Databases
Miscellaneous
