. 2009 Feb;96(3):840-57.
doi: 10.1016/j.bpj.2008.10.036.

Quantifying neurite growth mediated by interactions among secretory vesicles, microtubules, and actin networks

Affiliations

Quantifying neurite growth mediated by interactions among secretory vesicles, microtubules, and actin networks

Krasimira Tsaneva-Atanasova et al. Biophys J. 2009 Feb.

Abstract

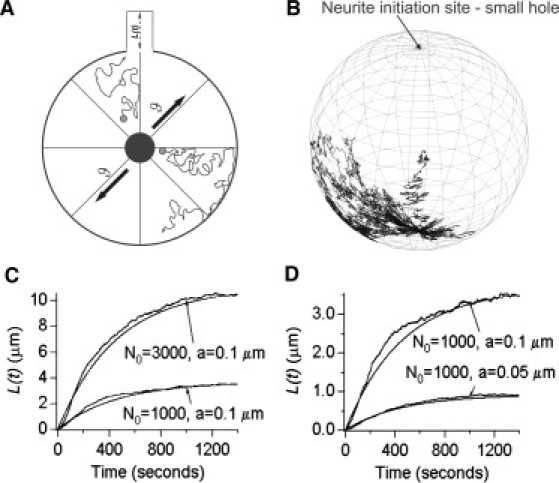
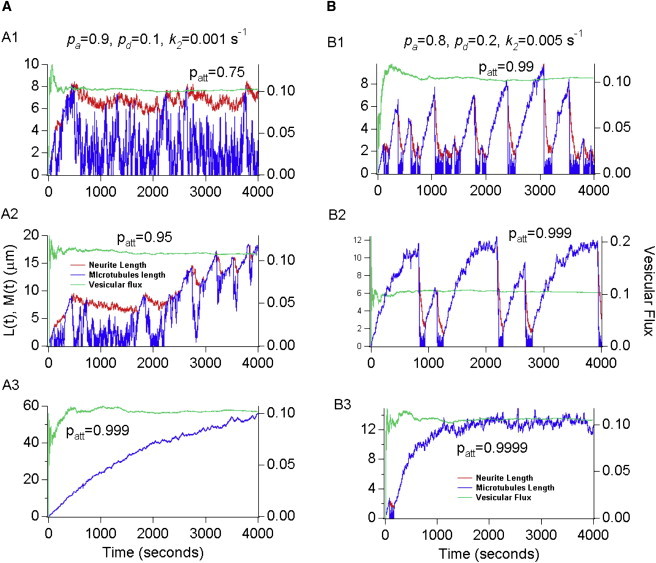
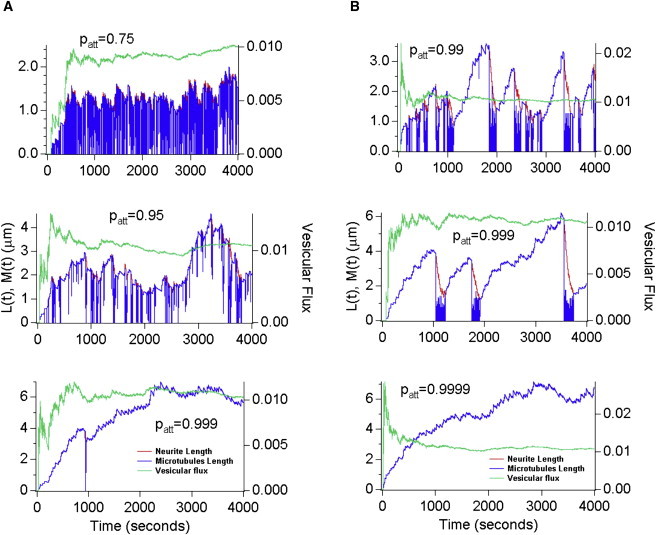
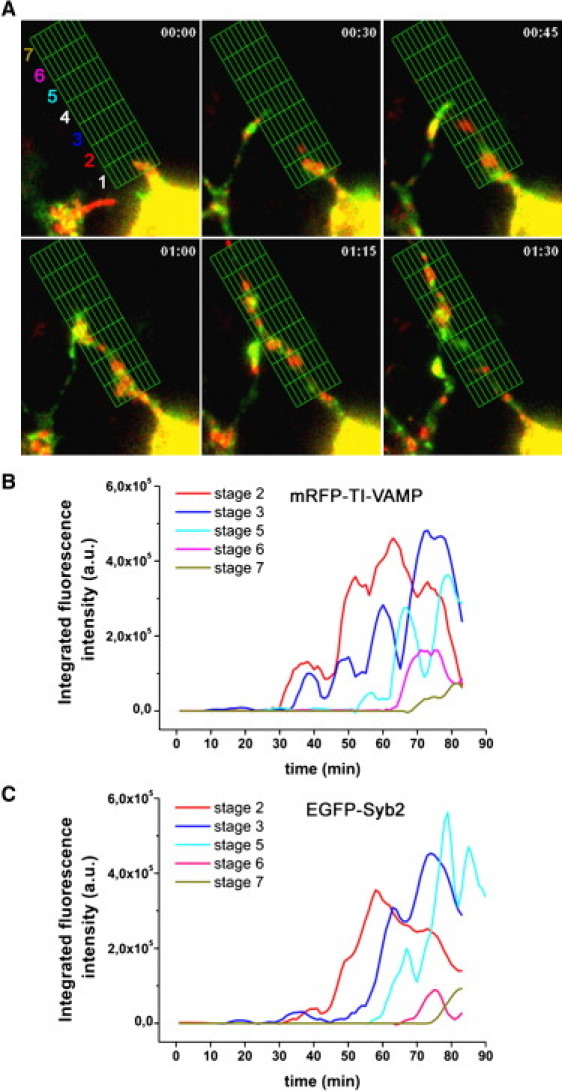
Neurite growth is a fundamental process of neuronal development, which requires both membrane expansions by exocytosis and cytoskeletal dynamics. However, the specific contribution of these processes has not been yet assessed quantitatively. To study and quantify the growth process, we construct a biophysical model in which we relate the overall neurite outgrowth rate to the vesicle dynamics. By considering the complex motion of vesicles in the cell soma, we demonstrate from biophysical consideration that the main step of finding the neurite initiation site relies mainly on a two-dimensional diffusion/sequestration/fusion at the cell surface and we obtain a novel formula for the flux of vesicles at the neurite base. In the absence of microtubules, we show that a nascent neurite initiated by vesicular delivery can only reach a small length. By adding the microtubule dynamics to the secretory pathway and using stochastic analysis and simulations, we study the complex dynamics of neurite growth. Within this model, depending on the coupling parameter between the microtubules and the neurite, we find different regimes of growth, which describe dendritic and axonal growth. To validate one aspect of our model, we demonstrate that the experimental flux of TI-VAMP but not Synaptobrevin 2 vesicles contributes to the neurite growth. We conclude that although vesicles can be generated randomly in the cell body, the search for the neurite position using the microtubule network and diffusion is quite fast. Furthermore, when the TI-VAMP vesicular flow is large enough, the interactions between the microtubule bundle and the neurite control the growth process. In addition, all of these processes intimately cooperate to mediate the various modes of neurite growth: the model predicts three different growing modes including, in addition to the stable axonal growth and the stochastic dendritic growth, a fast oscillatory regime. Finally our study demonstrates that cytoskeletal dynamics is necessary to generate long protrusion, while vesicular delivery alone can only generate small neurite.


Figures

Figure 1
Figure 1
Plot of the steady-state distribution (N0 = 1000) and the probability density function given by the Fokker-Planck equation. (A) Two-dimensional sample membrane vesicle trajectory obtained by simulating Eq. 2. (B) Two-dimensional sample membrane vesicle trajectory obtained by simulating Eq. 3.
Figure 2
Figure 2
(A) Schematic representation of the vesicles dynamics in the cell body, giving rise to a newly formed protrusion at the neurite initiation site. (B) A sample membrane vesicle trajectory in a three-dimensional cell produced by simulations of the homogenized version of the model (Eq. 3). (C) Plot of the simulated neurite length from Eq. 3 superimposed onto the curve produced by the formula for the mean length given in Eq. 19 for two different vesicles numbers that are available in the soma and endocytosis rate—k2 = 0.0022 s−1 (52,55). (D) Plot of the simulated neurite length from Eq. 3 superimposed onto the curve produced by the formula for the mean length given in Eq. 19 for two different vesicles radii and endocytosis rate—k2 = 0.0022 s−1 (52,55).
Figure 3
Figure 3
Schematic diagram of the neurite elongation model described by Eqs. 44–48.
Figure 4
Figure 4
Simulated neurite and microtubules lengths using Eqs. 44–48 and N0 = 6000. For a given set of parameters (A and B) we have increased the attachment probability patt until we obtain stable growth. (A) Langevin simulations of the neurite and microtubules lengths for the parameter values given in Table 1 and pa = 0.9, pd = 0.1, and k2 = 0.001 s−1 (52,55). (B) Langevin simulations of the neurite and microtubules lengths for the parameter values given in Table 1 and pa = 0.8, pd = 0.2, and k2 = 0.005 s−1 (52,55). The red traces denote neurite length L(t), blue traces denote microtubules bundle length M(t), and green traces indicate the flux of vesicles at the neurite tip, i.e., vesicles/second. As discussed in the text, the simulations show three main regimes, which represent: collapse (A1), oscillation (A2, B1, and B2) corresponding to dendritic growth and stable elongation (A3 and B3) associated with axonal growth.
Figure 5
Figure 5
Simulated neurite and microtubules lengths using Eqs. 44–48 and N0 = 600. For a given set of parameters (A and B) we have increased the attachment probability patt until we obtain stable growth. (A) Langevin simulations of the neurite and microtubules lengths for the parameter values given in Table 1 and pa = 0.9, pd = 0.1, and k2 = 0.001 s−1 (52,55). (B) Langevin simulations of the neurite and microtubules lengths for the parameter values given in Table 1 and pa = 0.8, pd = 0.2, and k2 = 0.005 s−1 (52,55). The red traces denote neurite length L(t), blue traces denote microtubules bundle length M(t), and green traces indicate the flux of vesicles at the neurite tip, i.e., vesicles/second.
Figure 6
Figure 6
TI-VAMP but not Syb2 accounts for neurite extension at early stage. (A) PC12 cells were co-transfected with mRFP-TI-VAMP (red) and EGFP-Syb2 (green). Neurite outgrowth is shown after the onset of neuritogenesis (00:00, h/min) induced by treatment with 100 nM staurosporine and followed by online video imaging over a time period of 1 h and 30 min (see Movie S1 and Movie S2 in Supporting Material). Note that TI-VAMP vesicles often accumulated at the tip of the growing neurite (Arrowheads. Bar = 5 μm). (B) Dynamics of FP-tagged proteins were followed during neurite initiation. Neurite was ideally segmented in seven different stages, from which integrated fluorescence intensity was collected (Fig. 7). The dynamics of fluorescence for mRFP-TI-VAMP (red continuous line) and EGFP-Syb2 (green continuous line) from one single stage and the length of neurite over the time were shown in the graph. (C) We generated neurite length using Eq. 21 from the experimentally measured fluorescence for the two types of vesicles, TI-VAMP (red dashed line) and Syb2 (green dashed line), and compared them with the experimental neurite length. The “Fitted TI-VAMP” curve fits the experimental neurite length curve better than “Fitted Syb2.”
Figure 7
Figure 7
Quantification of fluorescence intensity during neurite outgrowth. (A) Selected frames from Movie S2 show the mRFP-TI-VAMP (red) and EGFP-Syb2 (green) distribution along the growing neurite. To quantify the dynamics of the two FP-tagged proteins, the selected neurite was ideally segmented in seven stages (colored numbers), from the cell body limit to the maximal extent of the process. Then the integrated fluorescent intensity was automatically collected by using the grid module (green grid) of Metamorph software and converted in numerical data. The same grid was applied to analyze the dynamics of both FP-tagged proteins in the same selected neurite. Data collected were used to generate curves for every stage allowing comparing the dynamics between mRFP-TI-VAMP (B) and EGFP-Syb2 (C). In this example, because of movement of soma during the experiment and temporary overlap with a second growing neurite, respectively, neither stage 1 nor stage 4 were considered for the analysis. Only experimental data from stage 1 or 2 were used f or generate neurite length using Eq. 21.
Figure 8
Figure 8
Neurite length was generated using Eq. 21 from the experimentally measured fluorescence for the two types of vesicles—TI-VAMP and Syb2—and compared them with the experimental neurite length.

References

    1. da Silva J.S., Dotti C.G. Breaking the neuronal sphere: regulation of the actin cytoskeleton in neuritogenesis. Nat. Rev. Neurosci. 2002;3:694–704. - PubMed
    1. Burnette D.T., Schaefer A.W., Ji L., Danuser G., Forscher P. Filopodial actin bundles are not necessary for microtubule advance into the peripheral domain of Aplysia neuronal growth cones. Nat. Cell Biol. 2007;9:1360–1369. - PubMed
    1. Bouquet C., Ravaille-Veron M., Propst F., Nothias F. MAP1B coordinates microtubule and actin filament remodeling in adult mouse Schwann cell tips and DRG neuron growth cones. Mol. Cell. Neurosci. 2007;36:235–247. - PubMed
    1. Dent E.W., Gertler F.B. Cytoskeletal dynamics and transport in growth cone motility and axon guidance. Neuron. 2003;40:209–227. - PubMed
    1. Futerman A., Banker G. The economics of neurite outgrowth–the addition of new membrane to growing axons. Trends Neurosci. 1996;19:144–149. - PubMed

Publication types

LinkOut - more resources