. 2009 Feb;96(3):875-86.
doi: 10.1016/j.bpj.2008.10.040.

What determines the structure and stability of KFFE monomers, dimers, and protofibrils?

Affiliations

What determines the structure and stability of KFFE monomers, dimers, and protofibrils?

Giovanni Bellesia et al. Biophys J. 2009 Feb.

Abstract

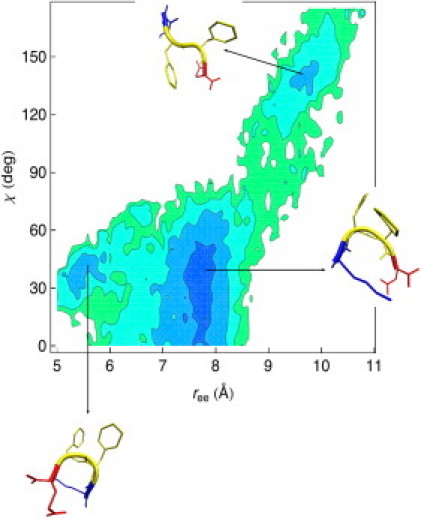
The self-assembly of the KFFE peptide was studied using replica exchange molecular dynamics simulations with a fully atomic description of the peptide and explicit solvent. The relative roles of the aromatic residues and oppositely charged end groups in stabilizing the earliest oligomers and the end-products of aggregation were investigated. beta and non-beta-peptide conformations compete in the monomeric state as a result of a balancing between the high beta-sheet propensity of the phenylalanine residues and charge-charge interactions that favor non-beta-conformations. Dimers are present in beta- and non-beta-sheet conformations and are stabilized primarily by direct and water-mediated charge-charge interactions between oppositely charged side chains and between oppositely charged termini, with forces between aromatic residues playing a minor role. Dimerization to a beta-sheet, fibril-competent state, is seen to be a cooperative process, with the association process inducing beta-structure in otherwise non-beta-monomers. We propose a model for the KFFE fibril, with mixed interface and antiparallel sheet and strand arrangements, which is consistent with experimental electron microscopy measurements. Both aromatic and charge-charge interactions contribute to the fibril stability, although the dominant contribution arises from electrostatic interactions.


Figures

Figure 1
Figure 1
(Top left) Ideal, planar structure for the extended, β-strand conformation of the peptide. (Bottom left) Representative snapshot of the β-strand monomer conformation obtained from REX-LD simulations. (Top right) Ideal, planar structure for the compact, U-shape conformation of the peptide. (Bottom right) Representative snapshot of the U-shape monomer conformation obtained from REX-LD simulations.
Figure 2
Figure 2
Free energy landscape of the monomer as a function of the two order parameters ree and χ obtained from REX-LD simulations at 310 K. The deepest blue color corresponds to the lowest value for the free energy (in Kcal/mol). Contour lines are drawn every 0.5 Kcal/mol. The free energy minimum at the top-right corner of the free energy map corresponds to the ensemble of the β-strand monomer conformations. The two free energy minima at the bottom left corner of the free energy map correspond to the ensemble of the U-shape monomers. The less compact U-shape monomers populate the larger of the two basins, while the more compact U-shape monomers populate the small basin. At the temperature T = 310 K, the non-β structures have the highest statistical weight, with the less compact non-β structures more populated that the more compact ones. The barrier height between the free energy basins of the β-strand monomers and of the U-shape monomers is ≈1.0 Kcal/mol.
Figure 3
Figure 3
Free energy landscape of the dimer as a function of the two order parameters r(1)ee + r(2)ee and χ(1) + χ(2) obtained from REX-LD simulations at 310 K. The deepest blue color corresponds to the lowest value for the free energy (in Kcal/mol). Contour lines are drawn every 0.5 Kcal/mol. Three main basins are present. The first one (bottom left, snapshots AC) consists of an ensemble of U-shaped dimers, the second one at the top-right of the free energy map is populated by the β-sheet dimers (snapshot E), and the third one (center of the map) corresponds to dimer conformations with one peptide in the β-strand conformation and the other in the U-shape conformation (snapshot D). At the temperature T = 310 K, the non-β dimers (snapshots AC) have the highest statistical weight. The barrier heights between the three main free energy basins are ≈0.5–1.0 Kcal/mol.
Figure 4
Figure 4
Representative structures for the free energy basins in Figs. 2 and 3. (Top) Snapshots of the two representative monomer conformations: U-shape (left) and β-strand (right). (Bottom) Snapshots of the representative dimer conformations: U-shape (left), mixed (center), and β-sheet (right) The competition between β and non-β structures in both monomer and dimer conformational phase space is the result of the balance between the high, intrinsic β-sheet propensity of the phenylalanine residues and charge-charge interactions that favor non-β conformations. At the temperature T = 310 K, the non-β monomers and dimers (top-right and bottom-right) have the highest statistical weight. The combined analysis of the relative statistical weights for monomer and dimer structures is presented in Structural Ensembles and Cooperativity Effects in the KFFE Dimer Formation.
Figure 5
Figure 5
Distance distributions for different, oppositely charged atom pairs at T = 310 K. The distributions show two significant peaks: a first peak at ∼2.6 Å corresponding to the formation of a direct salt bridge between oppositely charged atoms and a second peak located at ∼4.7 Å, which is consistent with a water-mediated contact. All the plots show that both 1), direct salt bridges and 2), water-mediated charge-charge interactions play a more important stabilization role for the U-shape monomer and dimer conformation than for the β-conformations. (Top left) Nk+OE (monomer). Direct salt bridges and water-mediated contacts between the charged atoms on the lysine (+) and glutamic acid (−) side chains represent the major ES contribution to the stability of the U-shape monomer structures. (Top right) Nk+OE (dimer, intramolecular). Intramolecular ES contacts (i) and (ii) between the charged atoms on the lysine and glutamic acid side chains are important only for the U-shape, non-β dimers. (Bottom left) NNT+OCT (dimer, intermolecular). Intermolecular ES contacts (i) and (ii) between charged termini are common to U-shape and β-sheet dimers. (Bottom right) Nk+OE (dimer, intermolecular). Intermolecular contacts between lysine and glutamic acid are important only for β-sheet dimers.
Figure 6
Figure 6
Monomer system: potential of the mean force in the Ramachandran space for the two central phenylalanine residues at T = 310 K. (Left) Phenylalanine in position 2. (Right) phenylalanine in position 3. (Top) Both phenylalanine residues in the β-strand monomers sample extensively the β-sheet region of the Ramachandran map. (Bottom) The phenylalanine residue close to the lysine residue (left) samples α-helix regions in the U-shape monomer while the phenylalanine residue close to the glutamic acid residue (right) samples the β-sheet region. The implication is that β- and non-β-monomer conformations are competing as a result of a balancing between 1), the intrinsic β-sheet propensity of the phenylalanine residues and 2), charge-charge interactions that favor non-β conformations.
Figure 7
Figure 7
(Top) The four different protofibril interfaces considered in our simulations. AP-KF and AP-MIXED have antiparallel, interlayer orientation while P-KF and P-MIXED have parallel, interlayer orientation. The protofibrils named AP-KF and P-KF have, at least, one close contact between lysine (K) and phenylalanine (F) at the interface level while the protofibrils named AP-MIXED and P-MIXED have a close contact between two phenylalanine residues at the interface level. All protofibrils have antiparallel intralayer orientation. (Middle) Time series for the backbone RMSD obtained from the single temperature simulations of the four different KFFE protofibrils. Only the P-KF and the AP-MIXED protofibrils are stable over a simulation time length of 50 ns. The RMSD time series eventually show that the structure labeled as “AP-MIXED” was the most stable over the simulation time length. (Bottom) Representative/average structure of the stable AP-MIXED protofibril. The average dimension of the stable AP-MIXED protofibril is consistent with the values of the fibril dimension (12–16 Å) calculated directly from electron micrographs.

References

    1. Dobson C.M. Protein folding and misfolding. Nature. 2003;426:884–890. - PubMed
    1. Serpell L., Sunde M., Blake C. The molecular basis of amyloidosis. Cell. Mol. Life Sci. 1997;53:871–887. - PMC - PubMed
    1. Makin O.S., Atkins E., Sikorski P., Johansson J., Serpell L.C. Molecular basis for amyloid fibril formation and stability. Proc. Natl. Acad. Sci. USA. 2005;102:315–320. - PMC - PubMed
    1. Makin O.S., Serpell L.C. X-ray diffraction studies of amyloid structure. Methods Mol. Biol. 2005;299:67–80. - PubMed
    1. Meredith S. Protein denaturation and aggregation—cellular responses to denatured and aggregated proteins. Cell Injury: Mech. Resp. Repair. 2005;1066:181–221. - PubMed

Publication types

LinkOut - more resources