. 2009 Feb;96(3):1045-55.
doi: 10.1016/j.bpj.2008.09.022.

Dynamics of thin-filament activation in rabbit skeletal muscle fibers examined by time-resolved x-ray diffraction

Affiliations

Dynamics of thin-filament activation in rabbit skeletal muscle fibers examined by time-resolved x-ray diffraction

Takumi Tamura et al. Biophys J. 2009 Feb.

Abstract

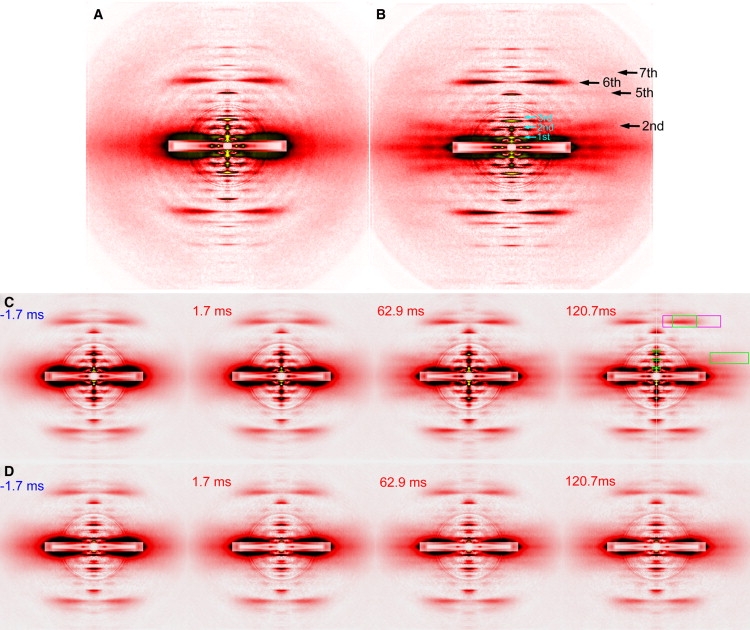
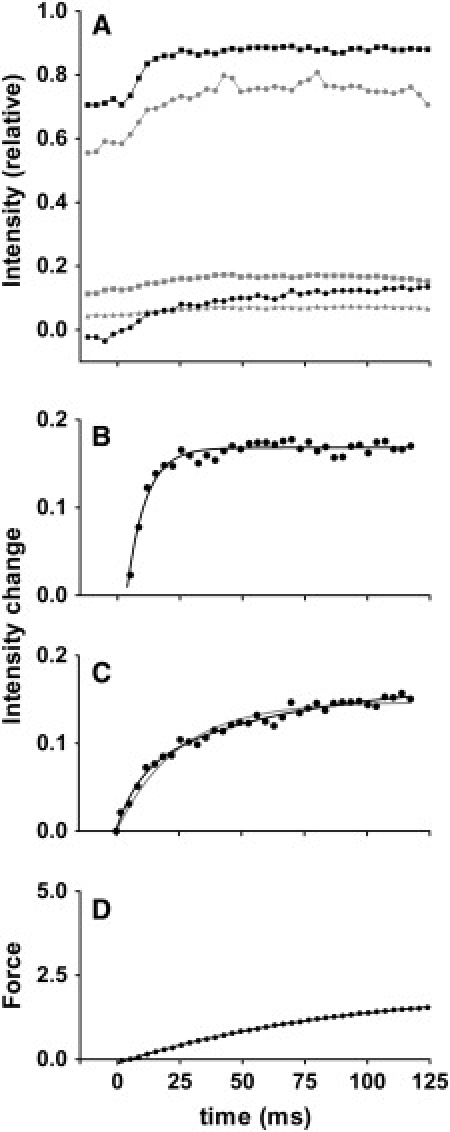
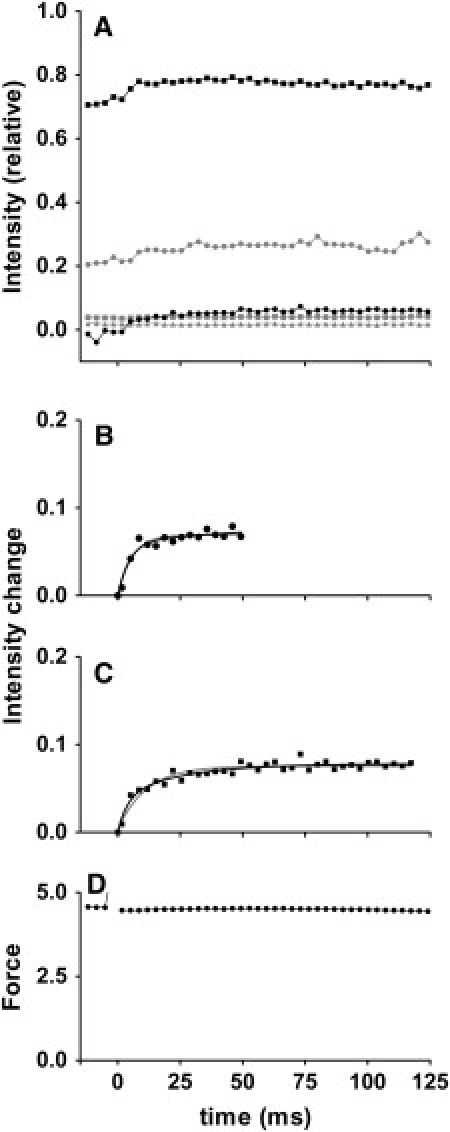
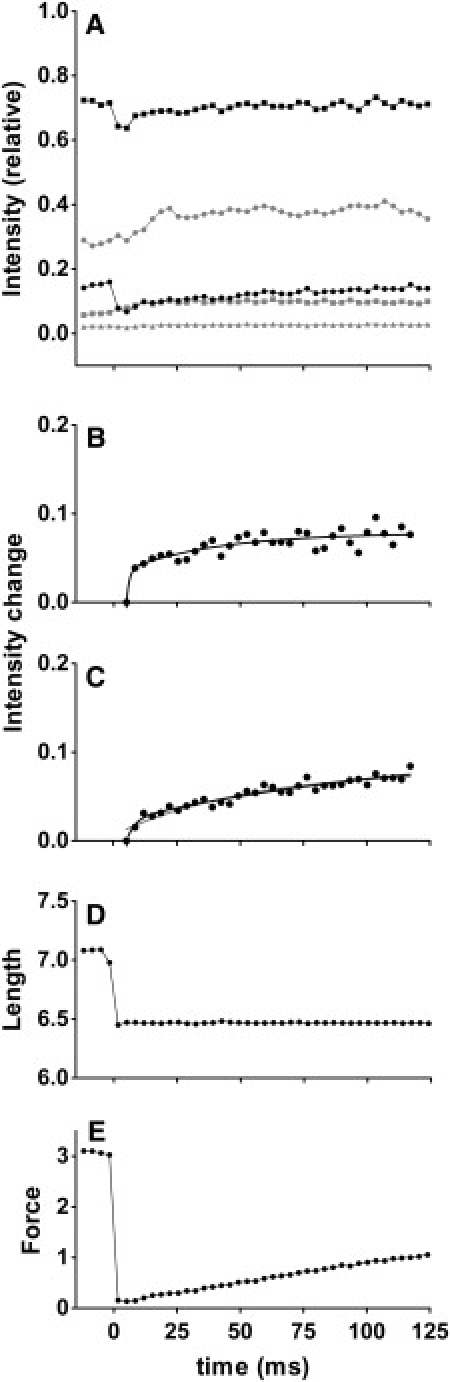
By using skinned-rabbit skeletal muscle fibers, the time courses of changes of thin filament-based x-ray reflections were followed at a 3.4-ms time resolution during thin-filament activation. To discriminate between the effects of calcium binding and myosin binding on thin-filament activity, measurements were performed after caged-calcium photolysis in fibers with full-filament or no-filament overlap, or during force recovery after a quick release. All three reflections examined, i.e., the second actin layer line (second ALL, reporting the tropomyosin movement), the sixth ALL (reporting actin structural change), and the meridional troponin reflections, exhibited calcium-induced and myosin-induced components, but their rate constants and polarities were different. Generally, calcium-induced components exhibited fast rate constants (>100 s(-1)). The myosin-induced components of the second ALL had a rate constant similar to that of the force (7-10 s(-1)), but that of the sixth ALL was apparently faster. The myosin-induced component of troponin reflection was the only one with negative polarity, and was too slow to be analyzed with this protocol. The results suggest that the three regulation-related proteins change their structures with different rate constants, and the significance of these findings is discussed in the context of a cooperative thin-filament activation mechanism.


Figures

Figure 1
Figure 1
Diffraction patterns from skinned-rabbit psoas fibers. (A, B) Static diffraction patterns recorded at BL45XU beamline of SPring-8. (A) Pattern in relaxing solution. (B) Pattern during isometric contraction, recorded from same fibers as in A. Black arrows indicate actin layer lines that are enhanced during contraction. Cyan arrows indicate meridional reflections from troponin. Summed image is of three fiber arrays consisting of 30 single fibers. Total exposure time, 120 s. Background scattering was subtracted by method described elsewhere (17). Four quadrants of patterns were folded and averaged. Overlapping circles in pattern are attributable to correction for the round aluminum attenuator, placed in front of the detector to prevent it from saturating. (C and D) Selected frames from time-resolved diffraction recordings in caged-calcium experiments performed at BL40XU beamline. (C) At full-filament overlap. (D) Overstretched fibers. Summed image is of 11–12 fiber bundles consisting of ∼60 fibers. Exposure time of each frame is 3.4 ms. Number in each panel is time after (red) or before (blue) flash photolysis. Areas of intensity integration are indicated as boxes in rightmost panel in C. Green box flanking the right edge is the area of second ALL. Green box on top is the area of sixth ALL, and magenta box is area of total intensity of sixth ALL, used as reference for all reflections. Small green boxes on meridian comprise area for troponin reflections.
Figure 2
Figure 2
Time courses of change of integrated intensities in caged-calcium experiments performed at full-filament overlap (from 12 fiber bundles). (A) Intensities above background level (black squares, sixth ALL; black circles, second ALL; gray circles, first-order troponin; gray squares, second-order troponin, gray triangles, third-order troponin). Intensities were normalized with respect to total intensity of sixth ALL before flash (Fig. 1, magenta box). Intensity of second ALL often becomes negative, because the subtraction was performed by connecting the two edges of reflection by a straight line, but the actual background is likely to be concave. The time for flash is set as 0. (B) Fit of intensity change of sixth ALL after flash. Averaged intensity before flash was subtracted from record in A. The curve is the best-fit single-exponential association function. (C) Fit of intensity change of second ALL after flash. Data can be fitted by either a double-exponential (black curve) or single-exponential (gray curve) association function, but the double-exponential function gives a better fit. (D) Time course of force development after flash, recorded simultaneously in x-ray recording (sum of data from all specimens, in arbitrary units). Data can be fitted with a single-exponential association function (curve). Isometric force generated by each fiber bundle was 24.3 ± 9.0 mN (n = 11, mean ± SD).
Figure 3
Figure 3
Time courses of changes of integrated intensities in caged-calcium experiments performed in overstretched fibers (from 11 fiber bundles). (A) Intensities above background level. Symbols are same as in Fig. 2. (B) Fit of intensity change of sixth ALL after flash. Because intensity tended to decrease again, the fitting was performed only for first 50 ms after flash. (C) Fit of intensity change of second ALL after flash. Data can be fitted by either a double-exponential (black curve) or single-exponential (gray curve) association function. (D) Time course of change of force after flash, recorded simultaneously in x-ray recording (sum of data from all specimens in arbitrary units, but on same scale as in Fig. 2D). Fibers show high passive force before flash. No active force develops after flash. Passive force that existed before flash in each fiber bundle was 47.4 ± 11.3 mN (n = 11, mean ± SD). This is twice as large as the active force, i.e., ∼2 × 10⁵N/m2. This is in agreement with the previously reported value (51).
Figure 4
Figure 4
Time courses of changes of integrated intensities in quick-release experiments (from 16 arrays of ∼30 single fibers). Intensities were normalized to total intensity of sixth ALL before release, which is expected to be up to 50% greater than in the relaxed state. (A) Intensities above background level. Symbols are same as in Fig. 2. (B) Fit of intensity change of sixth ALL after flash. Data are above lowest intensity after release. (C) Fit of intensity change of second ALL after release. Both curves can be fitted with a double-exponential association function. The rate constants for faster processes are large, and may represent recovery from a disoriented state immediately after release. (D) Fiber length (output of length signal from servomotor; sum of data from all specimens). Release amplitude was 2% of fiber length, and was complete in ∼1.5 ms. (E) Force (sum of data from all specimens, in arbitrary units). Recovery after release is fitted with a single exponential association function. The isometric force generated by each fiber array was 11.0 ± 2.2 mN (n = 10, mean ± SD). If diameter of a single fiber is 70 μm, the force per cross-sectional area is ∼1.0 × 10⁵ N/m2, in agreement with previous report of 1.24 × 10⁵ N/m2 (24).

References

    1. Ebashi S., Endo M. Calcium and muscle contraction. Prog. Biophys. Mol. Biol. 1968;18:123–183. - PubMed
    1. Gordon A.M., Homsher E., Regnier M. Regulation of contraction in striated muscle. Physiol. Rev. 2000;80:853–924. - PubMed
    1. Iwamoto H. Physiological consequences of thin filament cooperativity for vertebrate striated muscle contraction: a theoretical study. J. Muscle Res. Cell Motil. 2006;27:21–35. - PubMed
    1. Lehrer S.S., Morris E.P. Dual effects of tropomyosin and troponin-tropomyosin on actomyosin subfragment-1 ATPase. J. Biol. Chem. 1982;257:8073–8080. - PubMed
    1. Bremel R.D., Weber A. Cooperation within actin filament in vertebrate skeletal muscle. Nat. New Biol. 1972;238:97–101. - PubMed

Publication types

LinkOut - more resources