Review
. 2009 Jan 29;61(2):168-85.
doi: 10.1016/j.neuron.2009.01.002.

The normalization model of attention

Affiliations
Review

The normalization model of attention

John H Reynolds et al. Neuron. .

Abstract

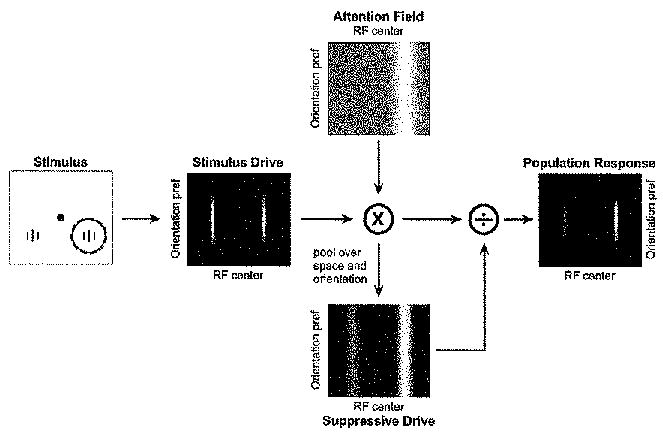
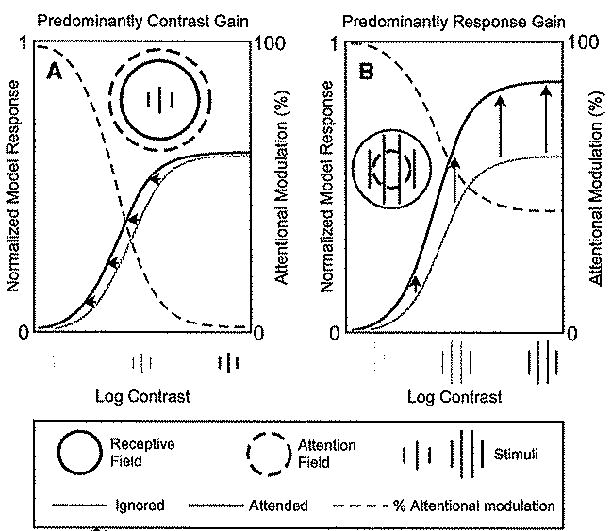
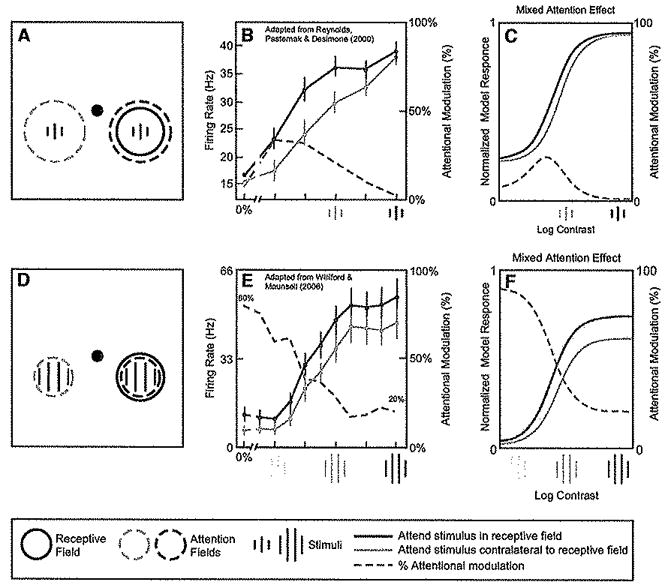
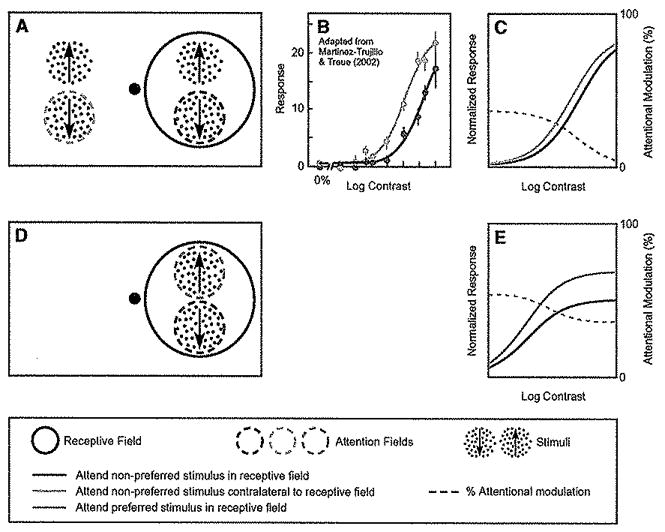
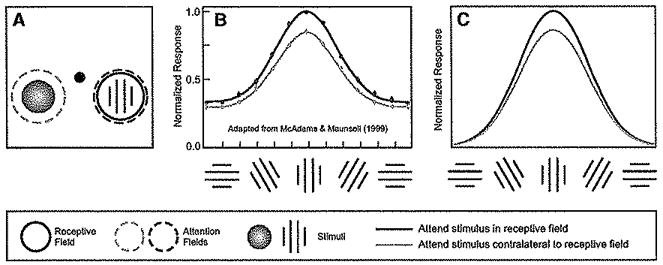
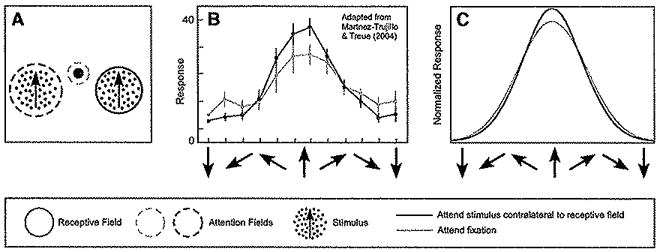
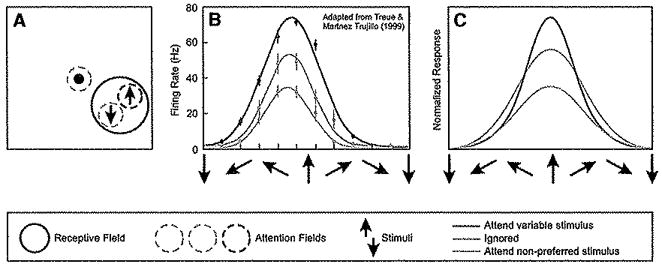
Attention has been found to have a wide variety of effects on the responses of neurons in visual cortex. We describe a model of attention that exhibits each of these different forms of attentional modulation, depending on the stimulus conditions and the spread (or selectivity) of the attention field in the model. The model helps reconcile proposals that have been taken to represent alternative theories of attention. We argue that the variety and complexity of the results reported in the literature emerge from the variety of empirical protocols that were used, such that the results observed in any one experiment depended on the stimulus conditions and the subject's attentional strategy, a notion that we define precisely in terms of the attention field in the model, but that has not typically been completely under experimental control.


Figures

Figure 1
Figure 1. Normalization Model of Attention
The stimulus drive is multiplied by the attention field and divided by the suppressive drive to yield the output firing rates. Left panel depicts the stimulus. A pair of vertically orientated gratings were presented as input to the model, identical in contrast, one in each hemifield. Central black dot, fixation point. Solid circle indicates the receptive field of a model neuron selective for vertical orientation and centered on the grating stimulus in the right hemifield. Dashed red circle indicates the attention field, which was centered on the stimulus on the right. Middle panel depicts the stimulus drive for a collection of neurons with different receptive field centers and orientation preferences. Neurons are organized according to their receptive field center (horizontal position) and preferred orientation (vertical position). Brightness at each location in the image corresponds to the stimulus drive to a single neuron. Top panel depicts the attention field when attending to the stimulus on the right (i,e., corresponding to the dashed red circle in She left panel). The attentional field is the strength of the attentional modulation as a function of receptive field center and orientation preference. Here, attentional gain varied as a function of stimulus position, without regard to orientation. Midgray indicates a value of 1 and white indicates a value greater than 1. The attention field is multiplied point-by-point with the stimulus drive. The suppressive drive (bottom panel) is computed from the product of the stimulus drive and the attention field, and then pooled over space and orientation. The panel on the right shows a neural image depicting the output firing rates of the population of neurons, computed by dividing the stimulus drive by the suppressive drive. The stimulus, stimulation field, suppressive field, and attention field all had Gaussian profiles in space and orientation.
Figure 2
Figure 2. The Normalization Model of Attention Exhibits Qualitatively Different Forms of Attentional Modulation, Depending on the Stimulus Size and the Size of the Attention Field
Each panel shows contrast-response functions for a simulated neuron, when attending to a stimulus within the neuron’s receptive field and when attending to a stimulus in the opposite hemifield. (A) Contrast gain for small stimulus size and large attention field. Red curve, simulated responses as a function of contrast when the stimulus in the receptive field was attended. Blue curve, responses when attending toward the opposite hemifield. Attentional modulation is indicated by the dashed gray curve, which quantifies the percentage increase in the responses when the stimulus within the neuron’s receptive field was attended versus not. The stimulus was 0.6 times the size to the stimulation field and the attention field was six times the size of the stimulation field (not drawn to scale, see Table 1 for simulation parameters). (B) Response gain for larger stimulus size and smaller attention field. In comparison to (A), the stimulus size was 5/3 larger (i.e., equal to the size of the stimulation field) and the attention field was 10 times smaller (i.e., about 2/3 the size of the stimulation field). All other model parameters were identical in both panels (Table 1).
Figure 3
Figure 3. Attentional Modulation of Neuronal Contrast-Response Functions
(A) Stimulus and task used by Reynolds et al. (2000) while recording neural activity in V4. Sequences of gratings were presented to the left and right visual fields, ons of which was positioned within the receptive field of the recorded neuron. Monkeys were cued to attend either to the stimulus sequence in the receptive field (dashed red circle) or the stimulus sequence in the opposite hemifield (dashed blue circle), to detect a target that appeared in the sequence. (B) Attention caused the largest percentage increase in firing rates at low contrast (adapted from Reynolds et al., 2000). Red curve and data points, responses as a function of contrast, when attention was directed to stimuli in the receptive field. Blue curve and data points, responses to the identical stimuli when unattended. Dashed gray curve, percentage increase in firing rate at each contrast. (C) Normalization model of attention can exhibit similar results. Stimuli, receptive fields, and attention fields are not drawn to scale; Simulation parameters are listed in Table 1. (D) Stimulus and task used in a similar experiment by Williford and Maunsell (2006), also while recording in V4. (E) Attention caused neither a pure contrast gain change nor a pure response gain change (adapted from Williford and Maunsell, 2006), Rather, the greatest percentage Increase in firing rates was at low contrasts (dashed gray curve), but with the largest absolute increase in firing rates at high contrasts {compare red and blue curves). (F) Normalization model of attention can exhibit similar results. The simulation was identical to that in (C) except (1) the stimttius was larger and attention field was smaller and (2) additional baseline activity was added for (C) (see Table 1).
Figure 4
Figure 4. Attentionat Modulation of Neuronal Contrast-Response Functions with Two Stimuli in the Receptive Field
(A) Stimulus and task used by Martinez-Trujillo and Treue (2002) while recording in MT. The contrast of the preferred direction stimulus (indicated by the upward arrow) within the receptive field was systematically varied across trials, whereas the contrast of the nonpreferred stimulus (indicated by the downward arrow) was held fixed. The monkey was cued to attend either the nonpreferred stimulus in the receptive field (dashed red circle) or the stimulus in the opposite hemifield (dashed blue circle) (B) Attention caused predominantly a change in contrast gain. Red curve and data points, responses as a function of contrast, when attention was directed to the nonpreferred stimulus in the receptive field. Blue curve and data points, responses to the Identical stimuli, when attending the opposite hemifield. Dashed gray curve, percentage increase in firing rate at each contrast. (C)Model simulation exhibiting results similar to those observed experimentally. (D) Complementary experiment with two stimuli placed within the receptive field, one preferred and the other nonpreferred. The contrasts of the two stimuli covaried (always identical to one another). (E) Simulated neuronal responses were larger when attention was directed to the preferred-direction stimulus (green curve) than when it was directed to the nonpreferred stimulus (red curve). The effect of attention was approximated by a response gain change (multiplicative scaling). Simulation parameters were identical to those in (C) (Table 1).
Figure 5
Figure 5. Spatial Attention Causes a Multiplicative Scaling of Tuning Curves
(A) Stimulus and task. On some trials, monkeys attended to the grating in the receptive field of the neuron being recorded (dashed red circle) to report whether two successive gratings were Identical or differed in orientation by 90°. On other trials, attention was instead directed to a colored blob appearing in the opposite hemifield (dashed blue circle) to report whether successive stimuli differed in color. (B) Orientation tuning curves averaged across a population of V4 neurons, with and without attention (adapted from McAdams and Maunsell, 1999). These curves were obtained by fitting each neuron’s tuning curve with a Gaussian, shifting the neuron’s preferred orientation to align all tuning curves and then averaging the Gaussian fits. Red indicates orientation tuning when attention was directed to stimuli in she receptive field, to perform the orientation discrimination task. Blue, orientation tuning when attention was directed away from the receptive field to perform the color discrimination task. (C) Model simulation yielded similar results; multiplicative scaling of the tuning curve when spatial attention was directed to a stimulus in the receptive field. See Table 1 for simulation parameters.
Figure 6
Figure 6. Feature-Based Attention Can Cause a Sharpening of Tuning Curves
(A) Stimulus and task. A pair of stimuli were presented simultaneously while recording responses of a neuron in visual cortical area MT. One stimulus was in the receptive field of the recorded neuron and the other was in the opposite hemifield. The directions of the two stimuli were yoked. The monkey was cued to attend either to the fixation point (dashed blue circle), or to the stimulus in the opposite hemifield (dashed red circle) to detect a change in speed or direction. That is, spatial attention was always directed away from the receptive field, but feature-based attention was matched to the stimulus in the receptive field on half the trials. (B) Feature-based attention caused a sharpening of motion direction tuning (adapted from Martinez-Trujillo and Treue, 2004). Blue, responses when attention was directed to the fixation point. Red, responses when attention was directed to the stimulus in the opposite hemifield. (C) Model simulations yielded similar results. Blue, responses of a model neuron when the attention field was flat (equal) for all motion directions, and spatial attention was directed away from the model neuron’s receptive field. Red, responses when attention was again directed away from the simulated neuron’s receptive field but to the same direction of motion as the stimulus in the receptive field. See Table 1 for simulation parameters.
Figure 7
Figure 7. Attentional Modulation of Tuning when Two Stimuli Are Present within the Receptive Field
(A) Stimulus and task. A pair of stimuli was presented simultaneously while recording responses of a neuron in visual cortical area MT. Both stimuli were presented within the recorded neuron’s receptive field. One stimulus moved in the nonpreferred direction (indicated as downward), and the other varied in motion direction. Attention was directed either to the fixation point (dashed yellow circle) or to one of the two stimuli in the receptive field (dashed red and blue circles) to detect a change in speed or direction. (B) Responses were larger when attending the variable direction stimulus (particularly when it moved in the preferred direction) and smaller when attending the nonpreferred stimulus (adapted from Treue and Martinez-Trujillo, 1999). Yellow, tuning (response as a function of the motion direction of the variable stimulus) when attention was directed to fixation. Blue, tuning when attention was directed to the nonpreferred stimulus. Red, tuning when attention was directed to the stimulus with variable motion direction. (C) Responses of a model neuron. Yellow, simulated responses when the attention field was flat (equal) for all motion directions, and spatial attention was directed to the fixation point (i.e., away from the model neuron’s receptive field). Blue, simulated responses when the attention field was selective for the spatial location corresponding to the receptive field of the model neuron, and selective for the direction of motion opposite to that preferred by the model neuron. Feature-based attention was thus restricted to a nonpreferred direction of motion. Red, simulated responses when the attention field matched that of the variable stimulus, i.e., with a spatial selectivity corresponding to the receptive field and with a direction selectivity that varied with the stimulus motion direction. See Table 1 for simulation parameters.

References

    1. Abbott LF, Chance FS. Drivers and modulators from push-pull and balanced synaptic input. Prog Brain Res. 2005;149:147–155. - PubMed
    1. Adelson EH, Bergen JR. Spatiotemporal energy models for the perception of motion. J Opt Soc Am A. 1985;2:284–299. - PubMed
    1. Albrecht DG, Hamilton DB. Striate cortex of monkey and cat: contrast response function. J Neurophysiol. 1982;48:217–237. - PubMed
    1. Albrecht DG, Gelsler WS. Motion sensitivity and the contrast-response function of simple cells in the visual cortex. Vis Neurosci. 1991;7:531–546. - PubMed
    1. Allman J, Miezin F, McGuinness E. Direction- and velocity-specific responses from beyond the classical receptive field in the middle temporal visual area. Perception. 1985;14:105–126. - PubMed

Publication types