. 2009 Jan 29;61(2):220-33.
doi: 10.1016/j.neuron.2008.11.010.

Mapping of class I and class II odorant receptors to glomerular domains by two distinct types of olfactory sensory neurons in the mouse

Affiliations

Mapping of class I and class II odorant receptors to glomerular domains by two distinct types of olfactory sensory neurons in the mouse

Thomas Bozza et al. Neuron. .

Abstract

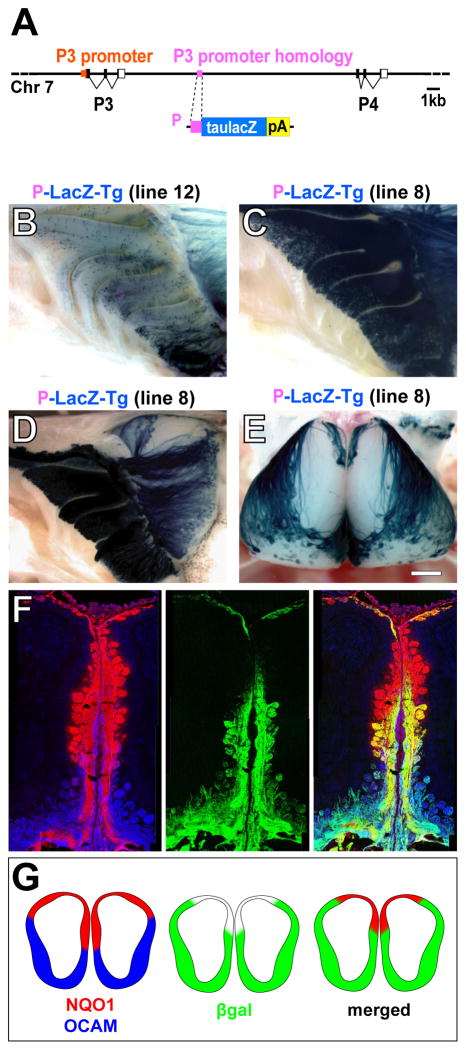
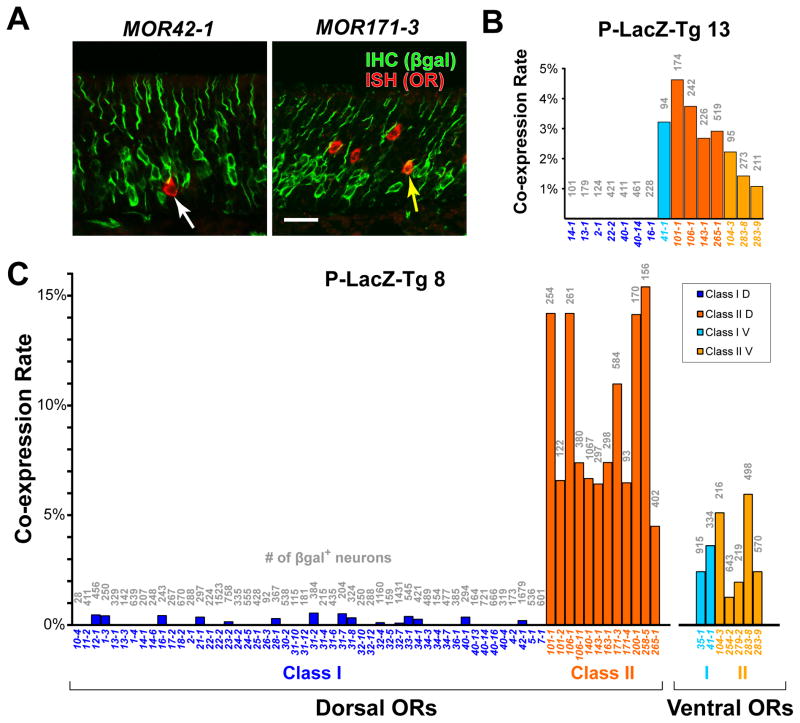
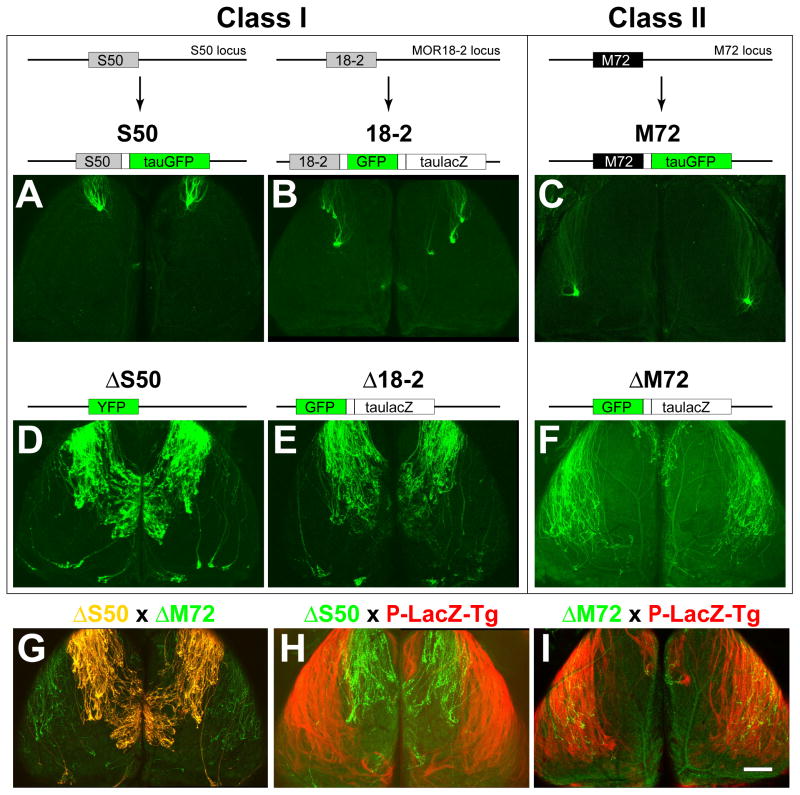
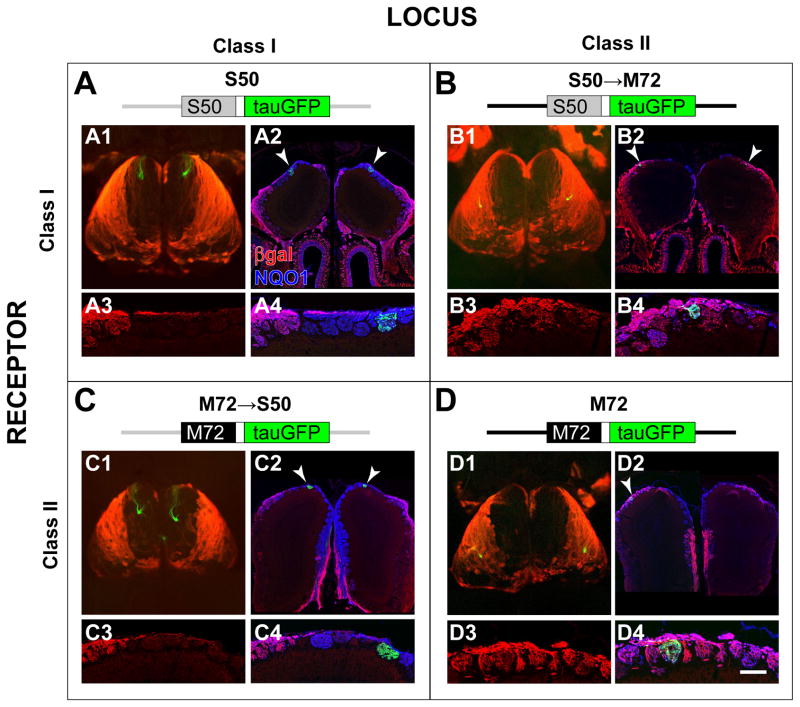
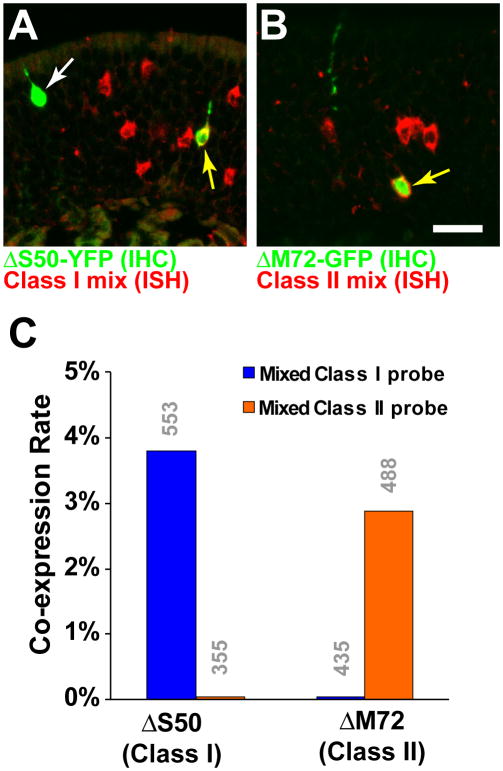
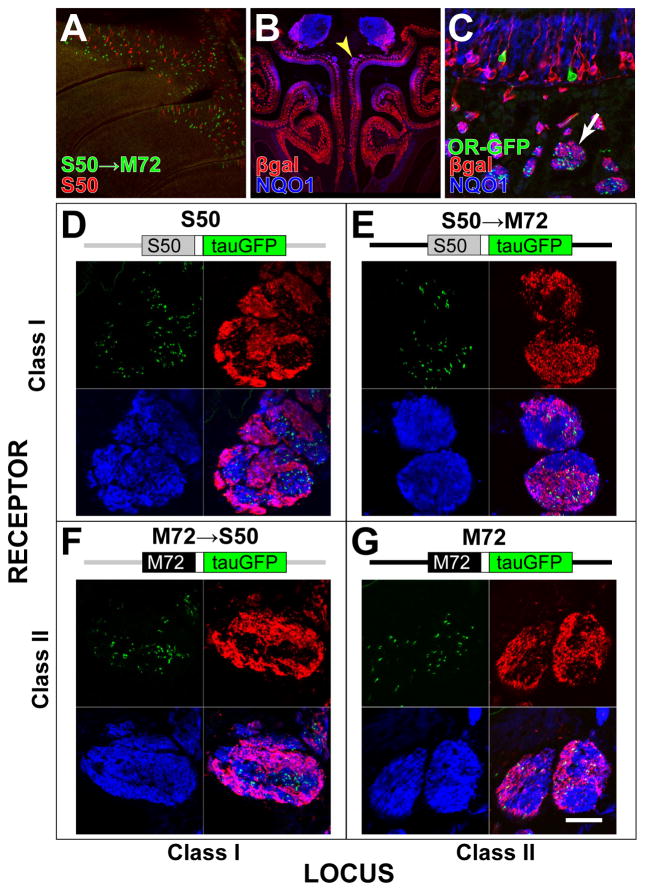
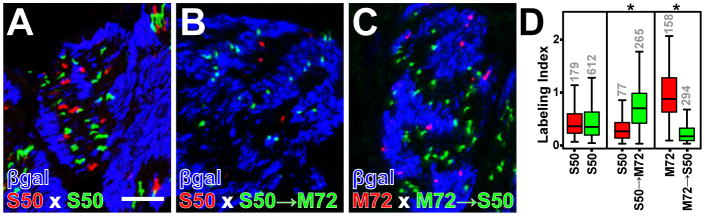
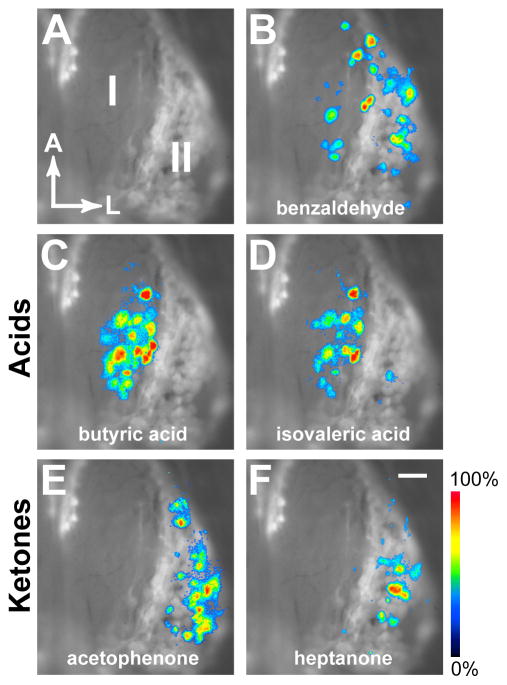
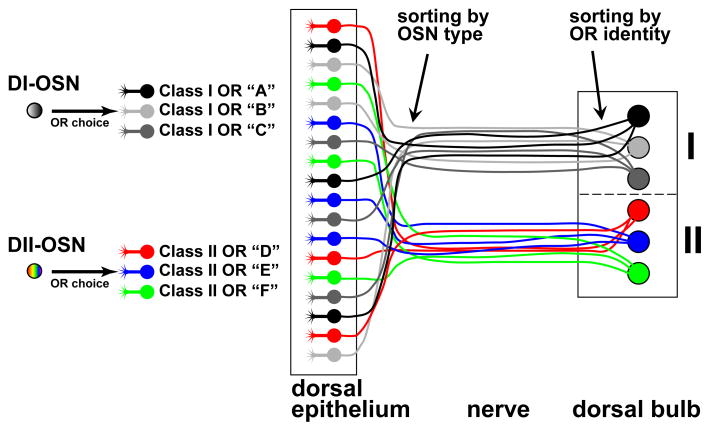
The repertoire of approximately 1200 odorant receptors (ORs) is mapped onto the array of approximately 1800 glomeruli in the mouse olfactory bulb (OB). The spatial organization of this array is influenced by the ORs. Here we show that glomerular mapping to broad domains in the dorsal OB is determined by two types of olfactory sensory neurons (OSNs), which reside in the dorsal olfactory epithelium. The OSN types express either class I or class II OR genes. Axons from the two OSN types segregate already within the olfactory nerve and form distinct domains of glomeruli in the OB. These class-specific anatomical domains correlate with known functional odorant response domains. However, axonal segregation and domain formation are not determined by the class of the expressed OR protein. Thus, the two OSN types are determinants of axonal wiring, operate at a higher level than ORs, and contribute to the functional organization of the glomerular array.


Figures

Figure 1
Figure 1. P-LacZ-Tg Reveals Two Domains in the Dorsal Olfactory Bulb
(A) (Top) Genomic region containing the P3 and P4 OR genes. The P3 promoter is shown in orange, the 317 nt sequence that is homologous to it (P sequence) in purple. (Below) The P-LacZ transgene; the coding sequence for taulacZ (blue box) is preceded by the P sequence (purple box), and followed by a rabbit β-globin polyadenylation sequence (pA; yellow box). (B) Medial view of X-gal stained wholemount of the MOE of a P-LacZ-Tg mouse of line 12. βgal+ neurons are scattered throughout the dorsal-ventral extent of the MOE. (C) Medial view of X-gal stained wholemount of the MOE of a P-LacZ-Tg mouse of line 8. This line expresses βgal in ~10% of OSNs throughout the dorsal-ventral extent of the MOE. (D) Medial view of X-gal stained wholemount of the MOE and OB of a P-LacZ-Tg mouse of line 8. βgal+ axons do not innervate a wedge-shaped region of the dorsal-medial OB. (E) Dorsal view of X-gal stained wholemount of the OBs of a P-LacZ-Tg mouse of line 8. βgal+ axons do not innervate a dorsal domain, which has a butterfly-like shape in a dorsal view. (F) Coronal sections from a P-LacZ-Tg mouse (line 8) showing the medial face of the OB stained by IHC with anti-NQO1 (red), anti-βgal (green) and anti-OCAM (blue). NQO1 and OCAM antibodies stain glomeruli in the dorsal and ventral parts of the OB, respectively. βgal+ axons innervate OCAM+ glomeruli and ventral NQO1+ glomeruli. The NQO1+ region can be subdivided into βgal+ and βgal regions. (G) Schematic drawings of OB sections of a P-LacZ-Tg mouse showing the overlap between βgal, NQO1 and OCAM-labeled domains. Scale bar in E is 500 μm in E; 420 μm in B and C; 760 μm in D; and 280 μm in F.
Figure 2
Figure 2. P-LacZ-Tg is a Marker for OSNs that Express Class II ORs
(A) Confocal image of combined ISH (red) for the Class I OR gene MOR42-1 (=S50) or MOR171-3 (=M72) and IHC for βgal (green) in a coronal section through the MOE of a P-LacZ-Tg mouse of line 8. White arrow in left panel indicates a single-labeled OSN, yellow arrow in right panel shows a double-labeled OSN. (B and C) Bar graphs showing the percentage of IHC βgal+ cells that are labeled by ISH with OR probes in P-LacZ-Tg mice, of line 13 in (B) and of line 8 in (C). Names of the OR probes are given below the x-axis. Numbers of cells counted for each probe are shown in grey above each bar. Of the 52 Class I probes, 21 were full-length OR coding sequences that should cross-hybridize with at least one other Class I OR due to >85% nucleotide identity. The total number of Class I OR transcripts assayed is estimated at 52–73, which is more than half of the Class I genes. Data are separated into dorsally and ventrally-expressed Class I and Class II OR genes. Scale bar is 25 μm in A.
Figure 3
Figure 3. ΔOR Mutations Reveal Complementary Domains in the Dorsal Olfactory Bulb
Confocal images of wholemounts of left and right OBs, dorsal views, anterior is up. (A) (Top) Structure of the S50 locus and the S50-IRES-tauGFP targeted mutation, in which the S50 coding region (grey box) is followed by an IRES (unlabeled white box) and tauGFP (green box) (Bottom) S50-GFP axons coalesce into glomeruli in the anterior-dorsal OB. (B) (Top) Structure of the MOR18-2 locus and the MOR18-2-IRES-GFP-IRES-taulacZ targeted mutation (termed MOL2.3-IGITL in Conzelmann et al., 2000), in which the MOR18-2 coding region (grey box) is followed by an IRES, GFP, a second IRES, and taulacZ (unlabeled large white box). (Bottom) 18-2-GFP axons coalesce into 3–4 glomeruli in the dorsal OB. (C) (Top) Structure of the M72 locus and the M72-IRES-tauGFP targeted mutation (Potter et al., 2001), in which the M72 coding region (black box) is followed by an IRES and tauGFP. (Bottom) M72-GFP axons coalesce into glomeruli in the dorsal-lateral OB. (D) (Top) Structure of the ΔS50 targeted mutation, in which the S50 coding region is replaced with YFP (green box). ΔS50 axons selectively innervate a circumscribed region of the dorsal-medial OB, and avoid the dorsolateral OB. (E) (Top) Structure of the Δ18-2 targeted mutation, in which the MOR18-2 coding region is replaced with GFP and followed by IRES and taulacZ. Δ18-2 axons show the same pattern of innervation as ΔS50 axons. (F) (Top) Structure of the ΔM72 targeted mutation (Feinstein et al., 2004), in which the M72 coding region is replaced with GFP and followed by IRES and taulacZ. ΔM72 axons project to a broad region of the lateral OB, and avoid a discrete domain in the dorsal-medial OB. (G) OBs of a mouse homozygous both for ΔS50 and ΔM72 alleles. GFP is partially separated from YFP on a spectral basis. GFP is detected in the green channel only, YFP is detected in the red and green channels and appears yellow. Labeled axons project to complementary domains, which cover most of the dorsal OB. (H) OBs of a P-LacZ-Tg (line 8) mouse that is heterozygous for ΔS50. The βgal+ axons (X-gal/Fast Red Violet staining, red) and ΔS50 axons (intrinsic GFP fluorescence, green) project to complementary domains in the dorsal OB. (I) OBs of a P-LacZ-Tg (line 8) mouse homozygous for ΔM72. βgal+ axons (red) and ΔM72 axons (green) project to overlapping domains in the dorsal-lateral OB. Scale bar in I is 470 μm in A–I.
Figure 4
Figure 4. ΔOR OSNs Are Skewed to Co-express OR Genes of the Same Class
(A) Combined ISH and IHC in the MOE of a ΔS50 homozygous mouse, using a mixed Class I OR probe (red). ΔS50 cells are labeled green. White arrow indicates a ΔS50 neuron that is not labeled with the mixed probe, yellow arrow indicates a ΔS50 OSN that co-expresses one (or more) Class I OR genes. (B) Combined ISH and IHC in the MOE of a ΔM72 homozygous mouse, using a mixed Class II OR probe (red). Yellow arrow indicates a ΔM72 OSN that co-expresses one (or more) Class II OR genes. (C) Percentage of ΔS50 or ΔM72 neurons that are double-labeled with the mixed Class I and Class II OR probes. OR co-expression in ΔOR OSNs is strongly skewed by OR class. Numbers of OSNs counted are indicated in grey above the bars. Scale bar in B is 20 μm in A, and 18 μm in B.
Figure 5
Figure 5. Glomerular Domains are Not Determined by the Class of the Expressed OR Protein
P-LacZ-Tg (line 8) was crossed to four alleles with an OR-IRES-tauGFP design. A schematic of the alleles is shown at the top of each panel. The S50 (Class I) locus and coding sequence are shown in grey, the M72 (Class II) locus and coding sequence are shown in black. (A1, B1, C1, D1) Wholemounts of the OBs show the relationship between the glomeruli innervated by OR-IRES-tauGFP OSNs (green), and the class domains revealed by X-gal/Fast Red Violet staining (red) for P-LacZ-Tg. (A2, B2, C2, D2) Coronal OB sections labeled with intrinsic GFP fluorescence (green), anti-βgal antibodies (red), and anti-NQO1 antibodies (blue). (A3, B3, C3, D3) High magnification of anti-βgal signals in the glomerular layer. (A4, B4, C4, D4) High magnification of all three markers shows the location of individual glomeruli. Overlay of red and blue is purple. S50 glomeruli (A) and M72→S50 glomeruli (C) are βgal, reside within the βgal domain in the dorsal-medial OB, and are surrounded by βgal glomeruli. In contrast, S50→M72 glomeruli (B) and M72 glomeruli (D) are βgal+, reside within the βgal+ domain in the dorsolateral OB, and are surrounded by βgal+ glomeruli. Scale bar in D4 is 1000 μm in A1, B1, C1 and D1; 250 μm in A2; 150 μm in A3 and A4; 250 μm in B2; 150 μm in B3 and B4; 580 μm C2; 175 μm in C3 and C4; 700 μm in D2; 100 μm in D3 and D4.
Figure 6
Figure 6. Class I and Class II Axons Segregate Within the Olfactory Nerve
(A) Wholemount confocal image of the turbinates showing the distribution of OSNs expressing S50→M72-IRES-tauGFP (green) and S50-IRES-tauRFP (red). OSNs are intermingled in the dorsal MOE, without obvious compartmentalization or patterning. (B) Coronal section through the olfactory mucosa of a P-LacZ-Tg hemizygous mouse of line 8, labeled by IHC with anti-βgal antibodies (red) and NQO1 antibodies (blue). Yellow arrowhead indicates the location of large segregated axon bundles. (C) Coronal section through the dorsal olfactory mucosa of a P-LacZ-Tg hemizygous (line 8), S50-IRES-tauGFP homozygous mouse labeled with intrinsic GFP fluorescence (green), and IHC with anti-βgal antibodies (red) and NQO1 antibodies (blue). The distribution of GFP, βgal and NQO1 signals can be seen in cross-sections through axon bundles (white arrow) in the lamina propria underneath the MOE. (D–G) A diagram of the targeted mutation is above each panel. Confocal images of cross-sections through axon bundles show the distribution of OR-defined axons (green) with respect to βgal+ axons (red) and NQO1+ axons (blue). βgal preferentially labels sub-compartments of the axon bundles. (D) Axons of OSNs expressing S50 from the endogenous S50 locus are associated preferentially in βgal axonal compartments. (E) Axons of OSNs expressing S50 from the M72 locus are found preferentially in βgal+ compartments. (F) Axons of OSNs expressing M72 from the S50 locus are found preferentially in βgal compartments. (G) Axons of OSNs expressing M72 from the endogenous M72 locus are found preferentially in βgal+ compartments. Scale bar in G is 400 μm in A; 700 μm in B; 35 μm in C; 25 μm in D–G.
Figure 7
Figure 7. Quantification of Axonal Segregation by OR Locus
(A–C) Confocal images of axon bundles in which axons from OSNs expressing tagged OR genes are labeled with RFP (red) or GFP (green). Axons expressing P-LacZ-Tg are labeled by IHC for βgal (blue). A Labeling Index (LI) is calculated for each OR-defined axon, ranging from 0 for axons located in a βgal compartment and ≥1 for axons located in a βgal+ compartment. (D) Distribution of the LI values observed for red or green axons in three pairwise crosses. Number of axons in each group is indicated in grey above each bar. Asterisks signify p-values <0.001 from unequal variance t-tests comparing the two means from each pairwise experiment. Scale bar in A is 12 μm for A–C.
Figure 8
Figure 8. Class Domains Correlate With Odorant Response Modules
(A) Class I/II domains revealed by X-gal/Fast Red Violet staining for βgal enzymatic activity in vivo, after removal of the skull and dura. Right OB is shown. Anterior is up, lateral is to the right. (B) Overlay of (A) with an activity pattern measured as the change in fluorescence of synaptopHluorin, following a 5 sec application of 5% benzaldehyde. Responses are seen in glomeruli in both domains. (C) Butyric acid at 5% and (D) isovaleric acid at 5% prefentially activate glomeruli in the Class I domain. (E) Acetophenone at 2% and (F) heptanone at 5% selectively activate glomeruli in the Class II domain. Response images were thresholded at 30% maximal response, pseudocolored and overlayed. Scale (bottom right) shows the synaptopHluorin signal intensity from blue (low) to red (high). Scale bar in F is 200 μm in A–F.
Figure 9
Figure 9. Model for Mapping of OSN Types to Glomerular Domains
The dorsal MOE contains two OSN types, which we refer to as DI and DII to reflect their dorsal position and choice of OR promoter. DI-OSNs choose promoters of Class I OR genes (grayscale), and DII-OSNs promoters of Class II OR genes (color). The cell bodies of DI- and DII-OSNs are intermingled in the dorsal MOE, and their axons segregate within the olfactory nerve via a mechanism that does not depend on the class of the expressed OR protein. DI-axons form glomeruli in the dorsal-medial OB (I), and DII-axons form glomeruli in the dorsal-lateral OB (II). Within each domain, axons sort into glomeruli via a mechanism that depends on the identity of the expressed OR protein.

References

    1. Bozza T, Feinstein P, Zheng C, Mombaerts P. Odorant receptor expression dfines functional units in the mouse olfactory system. J Neurosci. 2002;22:3033–3043. - PMC - PubMed
    1. Bozza T, McGann JP, Mombaerts P, Wachowiak M. In vivo imaging of neronal activity by targeted expression of a genetically encoded probe in the mouse. Neuron. 2004;42:9–21. - PubMed
    1. Buck L, Axel R. A novel multigene family may encode odorant receptors: a molecular basis for odor recognition. Cell. 1991;65:175–187. - PubMed
    1. Buck LB. Information coding in the vertebrate olfactory system. Annu Rev Neurosci. 1996;19:517–544. - PubMed
    1. Bulfone A, Wang F, Hevner R, Anderson S, Cutforth T, Chen S, Meneses J, Pedersen R, Axel R, Rubenstein JL. An olfactory sensory map develops in the absence of normal projection neurons or GABAergic interneurons. Neuron. 1998;21:1273–1282. - PubMed

Publication types

MeSH terms

LinkOut - more resources