. 2009 Jan 29;61(2):259-71.
doi: 10.1016/j.neuron.2008.12.004.

Axon initial segment Ca2+ channels influence action potential generation and timing

Affiliations

Axon initial segment Ca2+ channels influence action potential generation and timing

Kevin J Bender et al. Neuron. .

Abstract

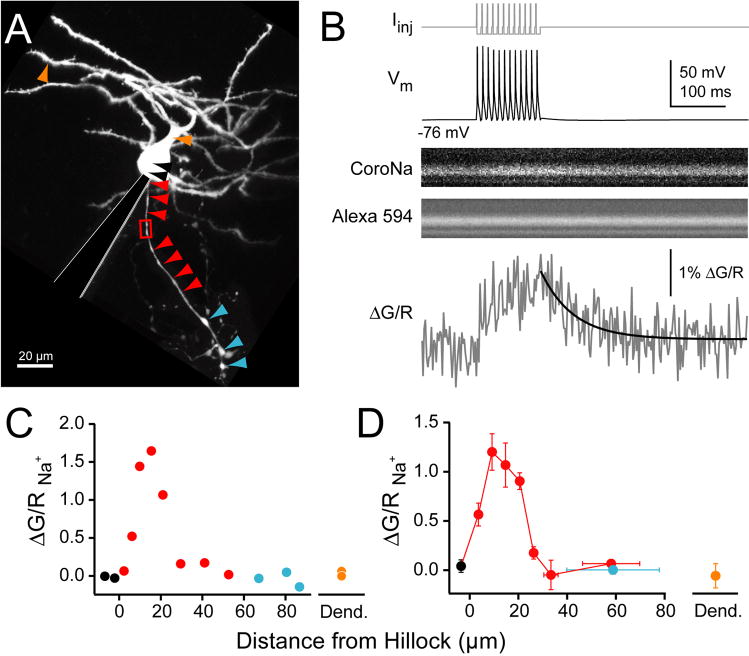
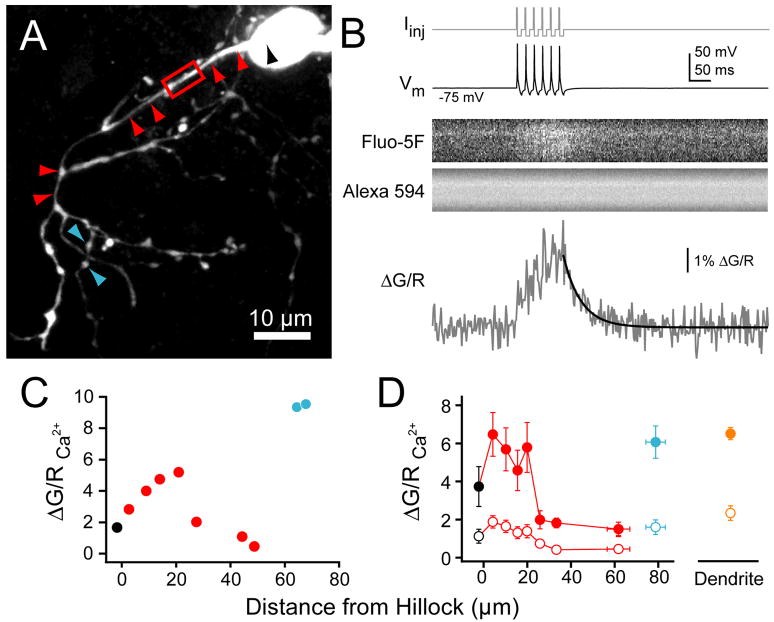
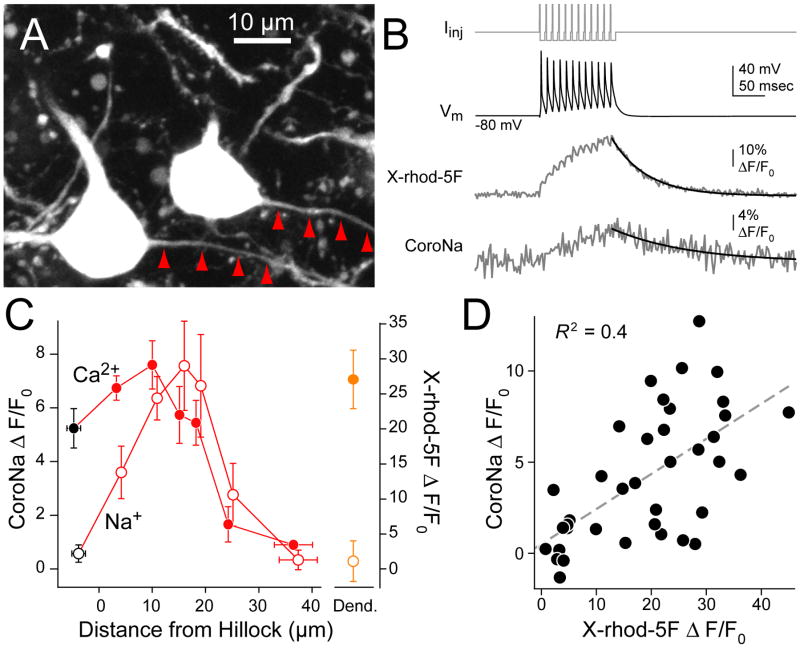
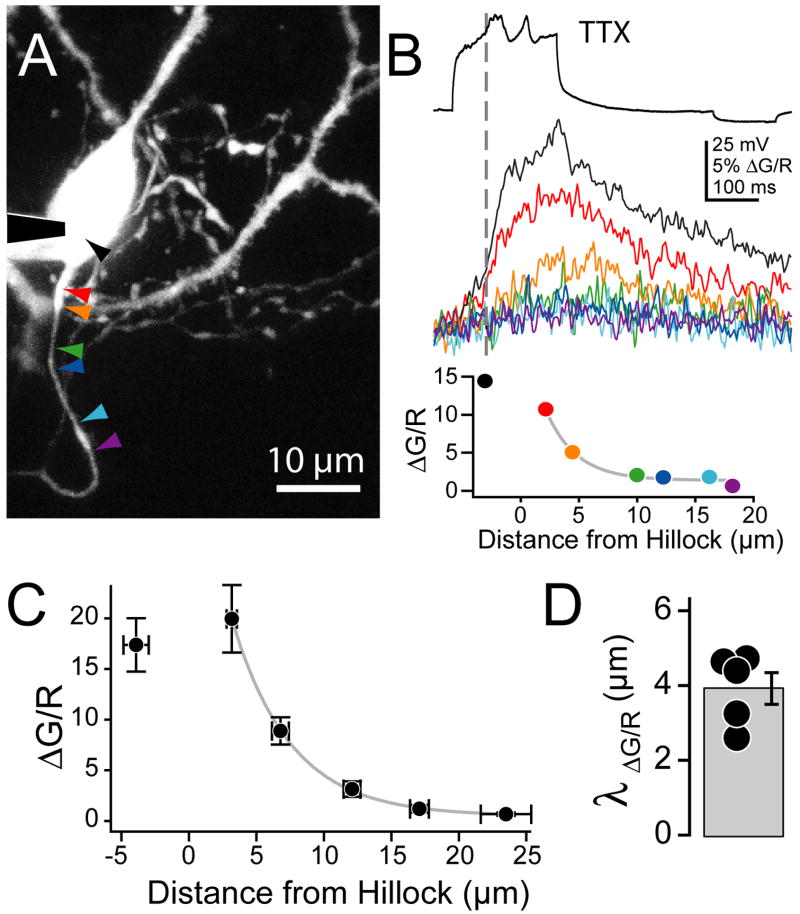
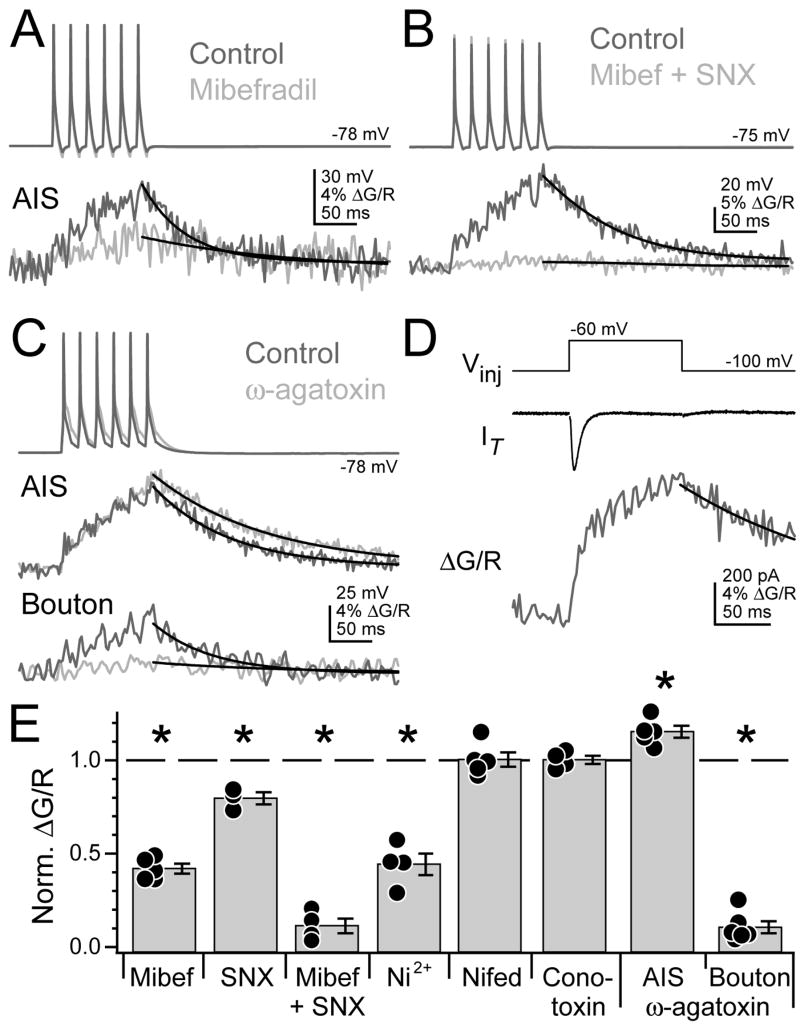
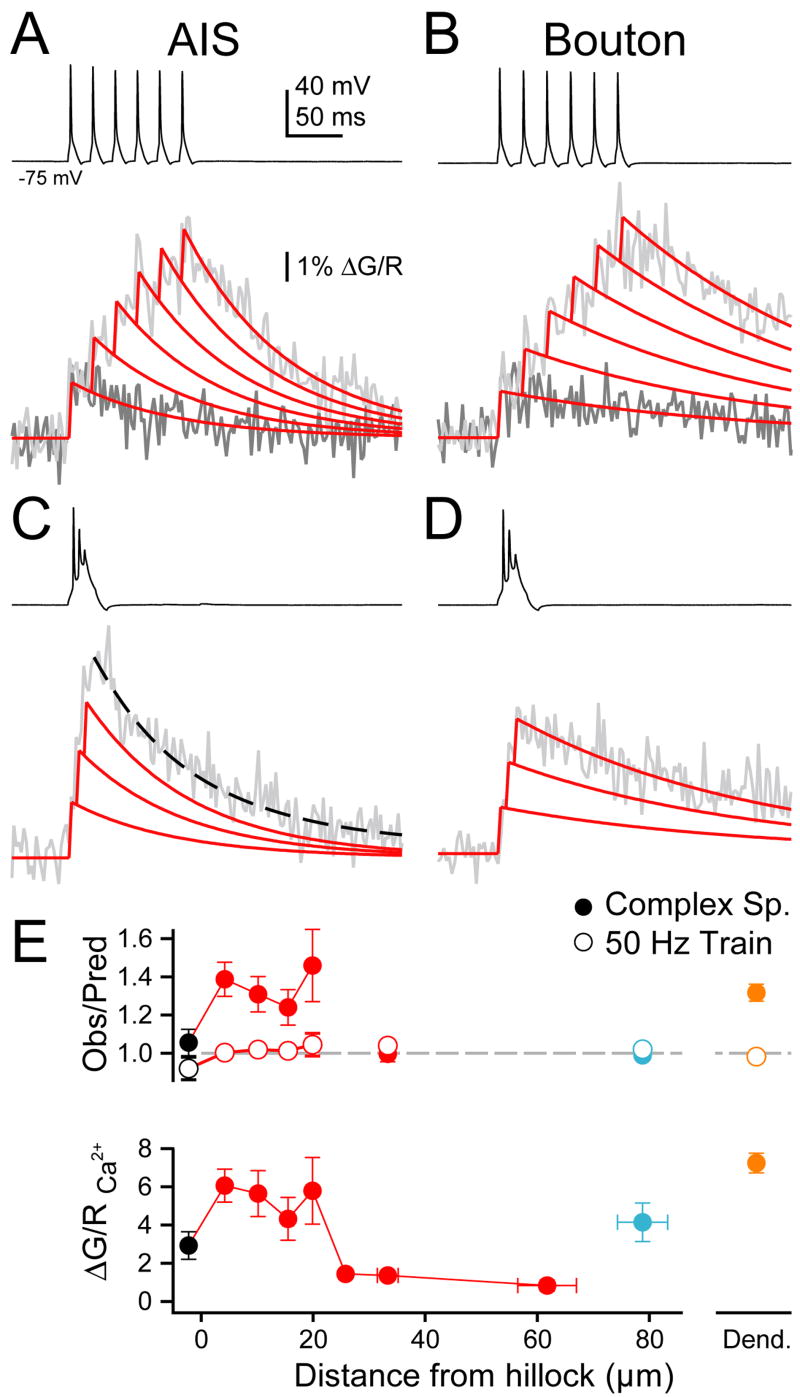
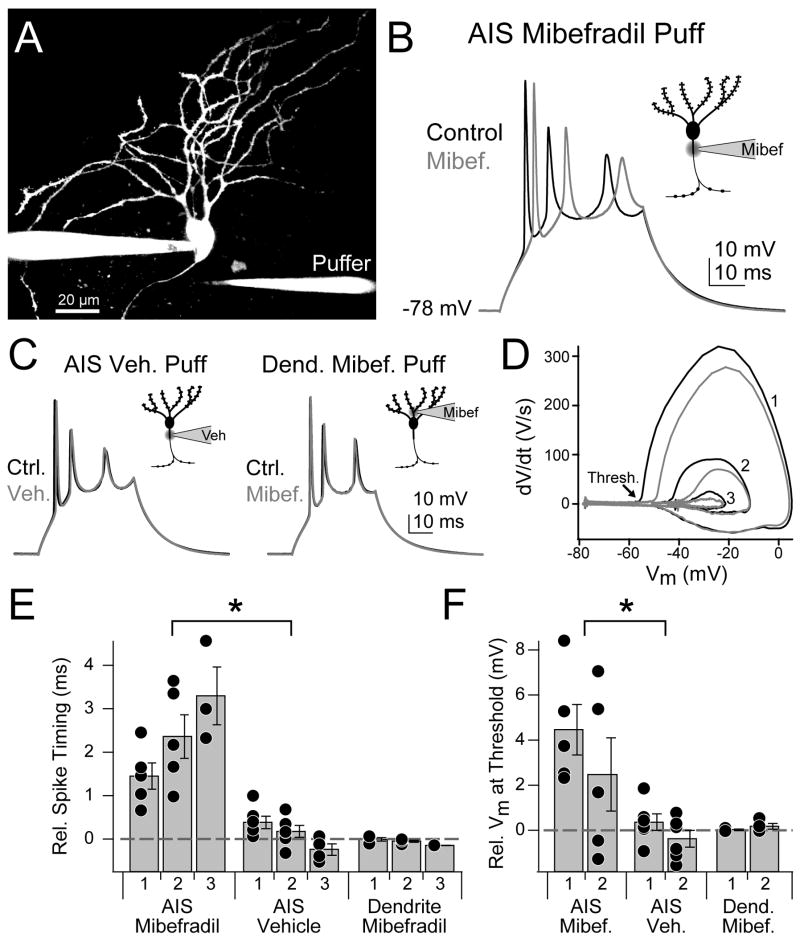
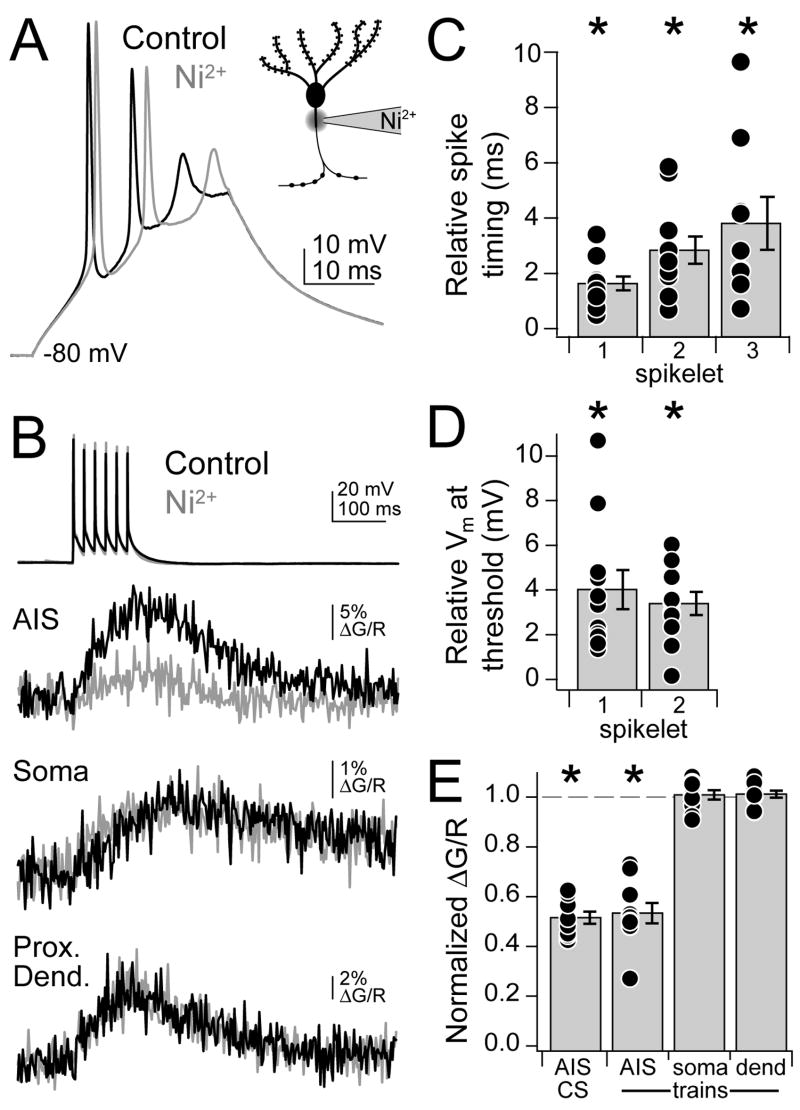
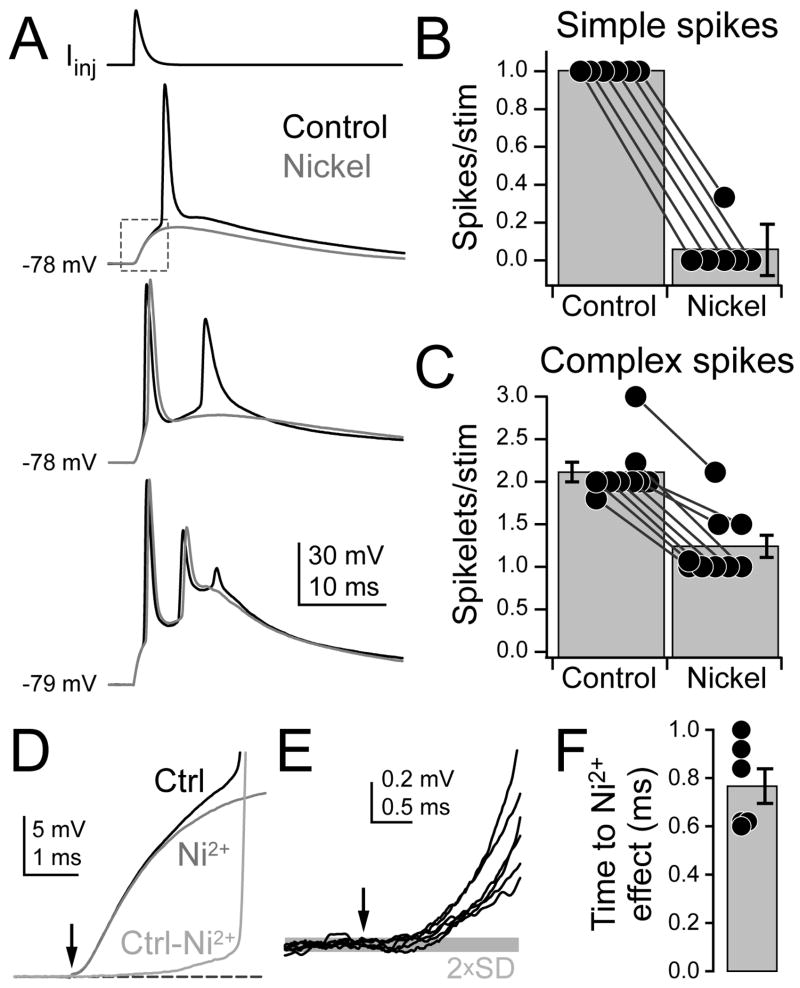
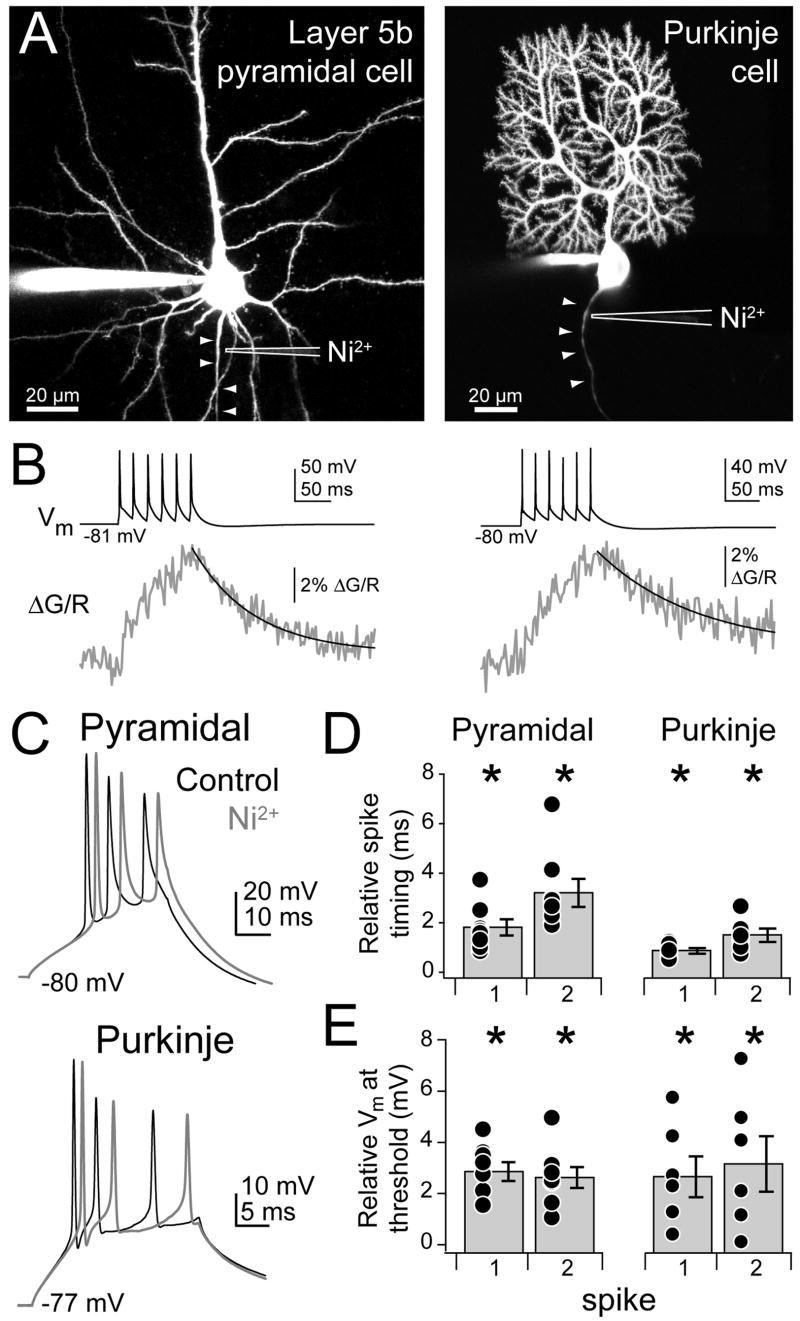
Although action potentials are typically generated in the axon initial segment (AIS), the timing and pattern of action potentials are thought to depend on inward current originating in somatodendritic compartments. Using two-photon imaging, we show that T- and R-type voltage-gated Ca(2+) channels are colocalized with Na(+) channels in the AIS of dorsal cochlear nucleus interneurons and that activation of these Ca(2+) channels is essential to the generation and timing of action potential bursts known as complex spikes. During complex spikes, where Na(+)-mediated spikelets fire atop slower depolarizing conductances, selective block of AIS Ca(2+) channels delays spike timing and raises spike threshold. Furthermore, AIS Ca(2+) channel block can decrease the number of spikelets within a complex spike and can even block single, simple spikes. Similar results were found in cortex and cerebellum. Thus, voltage-gated Ca(2+) channels at the site of spike initiation play a key role in generating and shaping spike bursts.


Figures

Fig. 1
Fig. 1. Na+ transients in cartwheel cells
(A) Maximum intensity montage of cartwheel cell. Arrowheads correspond to quantification in (C–D). Black: soma, red: axonal shaft, cyan: boutons, orange: dendrite. Red box: site of linescan highlighted in (B). (B) Top: somatic current drives 12 simple spikes at 100 Hz. Middle: Na+ in initial segment visualized with CoroNa, morphology visualized with Alexa 594. Bottom: Na+ transients (grey) are computed as change in green fluorescence (G; CoroNa) over red (R; Alexa). Decay was fit with single exponential (black). (C) Maximal ΔG/R from 100 Hz train at points shown for cell in (A). (D) Summary ΔG/R across 4 cells (3–7 linescans/bin). Bars are SEM.
Fig. 2
Fig. 2. Ca2+ transients in cartwheel cells
(A) Maximum intensity projection of cartwheel local axonal field. Arrowheads correspond to quantification in (C–D). Black: soma, red: axonal shaft, cyan: boutons. Red box: site of linescan highlighted in (B). (B) Top: somatic current drives 6 simple spikes at 50 Hz. Middle: Ca2+ in initial segment visualized with Fluo-5F, morphology visualized with Alexa 594. Bottom: Ca2+ transients (grey) are computed as change in green fluorescence (G; Fluo-5F) over red (R; Alexa). Decay was fit with single exponential (black). (C) Maximal ΔG/R from 50 Hz train for cell in (A) at points along axon. (D) Summary ΔG/R across 6 cells (4–11 linescans/bin). Closed circles: 50 Hz train, open: single spikes. Linescans were performed through distal dendrite for comparison. Bars are SEM.
Fig. 3
Fig. 3. Simultaneous Na+ and Ca2+ imaging in GFP+ cartwheel cells
(A) Maximum intensity projection of two GFP+ cartwheel cells. Red arrowheads trace axons. (B) Top: somatic current drives 12 simple spikes at 100 Hz. Bottom: example of simultaneous Ca2+ (X-rhod-5F) and Na+ (CoroNa) transients 17 μm from axon hillock. Decay was fit with single exponential (black). (C) Na+ (CoroNa, open circles) and Ca2+ (X-rhod-5F, closed circles) transients in soma (black), axon (red) and dendrites (orange). Bars are SEM. (D) Na+ transient amplitude vs. Ca2+ transient amplitude at each imaging location in axon. n = 39 sites from 4 cells.
Fig. 4
Fig. 4. . AIS Ca2+ requires active depolarization of the AIS
(A) Maximum intensity projection of cartwheel cell detailing axon initial segment. Arrowheads correspond to Ca2+ transients and peak ΔG/R amplitudes in (B) and (C), respectively. (B) Ca2+ transients (middle) are aligned to the max dV/dt of initial underlying complex spike waveform isolated in 500 nM TTX (top). ΔG/R at points along axon (bottom). Colors correspond to traces above and sites in (A). Grey line: single exponential fit. Experiments performed in 2.4 mM external Ca2+. (C) Summary of decay of peak Ca2+ transient with distance from axon hillock (n = 5 cells). (D) Space constant of Ca2+ decay. Bars are SEM.
Fig. 5
Fig. 5. AIS contains T- and R-type Ca2+ channels
(A) Trains of simple spikes (top) drive Ca2+ transients in AIS (bottom), measured 15 μm from hillock. Dark grey: control. Light grey: mibefradil in bath. Black: fits to peak. (B) Mibefradil + SNX-482 largely abolish Ca2+ transient. (C) ω-agatoxin reduces bouton Ca2+ transient (bottom), but not AIS Ca2+ (middle). Shades in (B–C) as in (A). (D) T-channel currents (IT, middle) isolated by voltage steps from −100 to −60 mV (top) produce a Ca2+ transient in AIS (bottom). (E) Summary of Ca2+ transient amplitudes in the presence of various voltage-gated Ca2+ channel antagonists, normalized to control levels. Asterisk: p < 0.05, one sample t-test. Bars are SEM.
Fig. 6
Fig. 6. Complex spike-triggered axonal Ca2+ transients
(A) Train (black) and corresponding Ca2+ imaging in AIS. Dark grey, Ca2+ from single spike. Light grey, Ca2+ from train. Red, linear sum of fit of single spike transient, temporally offset to match train timing. Scale applies to (A–D). (B) Train in Bouton. Color code as in (A). (C) Complex spike in AIS. Red solid: expected fit. Black dash: actual fit. (D) Complex spike in bouton. (E) Top, observed Ca2+ amplitude divided by predicted amplitude from linear sum for train and complex spike. Bottom, maximum ΔG/R values for complex spikes along axon. Color code as in Fig. 1. Bars are SEM.
Fig. 7
Fig. 7. AIS T-type channels shape complex spikes
(A) Maximum intensity projection of cartwheel cell showing placement of puffer pipette near AIS. (B) Complex spikes evoked via somatic depolarization paired with mibefradil puffs onto AIS. (C) Vehicle puffs onto AIS (left) and mibefradil puffs onto proximal dendrite (right) did not alter complex spikes. Insets in (B–C): schematic cartwheel cell detailing pipette placement. (D) Phase plane plot of complex spikes shown in (B). Arrow shows spike threshold for first spikelet. Numbers correspond to spikelet sequence in complex spike. Color code as in (B). (E) Relative timing of spike peak for all conditions (n = 5 cells). AIS mibefradil puffs delay spike timing. (F) Relative threshold Vm for spikelets 1 and 2 of complex spike (n = 5). Threshold is more depolarized with AIS mibefradil puffs. Asterisk: p < 0.05, ANOVA. Bars are SEM.
Fig. 8
Fig. 8. AIS Ni2+ iontophoresis alters complex spikes
(A) Complex spikes evoked via somatic depolarization paired with Ni2+ iontophoresis onto AIS. Black: control. Grey: Ni2+. Inset: schematic cartwheel cell detailing pipette placement. (B) 50 Hz simple spike trains and corresponding Ca2+ transients in AIS, soma, and proximal dendrite in control conditions (black) and when paired with AIS Ni2+ iontophoretic injection (grey). (C) Relative timing of spike peak for all conditions (n = 11 cells). Ni2+ delays spike timing. (D) Relative threshold Vm for spikelets 1 and 2 of complex spike (n = 11). Threshold is more depolarized with Ni2+. (E) Normalized ΔG/R for Ni2+ iontophoresis compared to control conditions (n = 10). Relative amplitudes are shown for complex spikes (CS) in the AIS, and trains in the AIS, soma, and proximal dendrite. Asterisk: p < 0.05, one sample t-test. Bars are SEM.
Fig. 9
Fig. 9. AIS T-channel block reduces the probability of spiking
(A) EPSP-like injected waveform (top) of variable amplitude drives 1, 2, or 3 spikes (bottom, black). Interleaved trials paired with Ni2+ iontophoresis show reduced numbers of spikes (grey). (B–C) Summary for experiments where single simple spikes (B) or complex spikes (C) were evoked. Dots are averages from 9–16 trails/cell (n = 6 simple, 9 complex). Lines connect conditions within a cell. (D) View of area highlighted by dashed box in (A). “Ctrl-Ni2+” is a subtraction of the two traces. (E) Lines are average Ctrl-Ni2+ traces for each cell where single spikes were examined (n = 6, see Methods). Grey bar: Average 2×standard deviation (2×SD) of baseline. Arrow in (D–E): stimulus onset. (F) Time Ctrl-Ni2+ trace emerged from noise (2×SD), relative to stimulus onset (n = 6). Bars are SEM.
Fig. 10
Fig. 10. AIS Ca2+ channels alter spike bursts in pyramidal and Purkinje cells
(A) Maximum intensity projections of cortical layer 5b pyramidal cell (left) and cerebellar Purkinje cell (right). Arrowheads follow axon. Iontophoretic pipette containing Ni2+ is outlined in white. (B) Train of spikes (top) drives Ca2+ transients in AIS (bottom), measured 15 μm from hillock for pyramidal (left) and Purkinje cells (right). (C) Spike bursts evoked via somatic depolarization paired with Ni2+ iontophoresis onto AIS in both cell types. Black: control. Grey: Ni2+. (D) Relative timing of spike peak. Ni2+ delays spike timing. (E) Relative threshold Vm. Threshold is more depolarized with Ni2+. Asterisk: p < 0.05, one sample t-test. n = 8 pyramidal cells, 6 Purkinje cells. Bars are SEM.

References

    1. Aizenman CD, Linden DJ. Rapid, synaptically driven increases in the intrinsic excitability of cerebellar deep nuclear neurons. Nat Neurosci. 2000;3:109–111. - PubMed
    1. Bean BP. The action potential in mammalian central neurons. Nat Rev Neurosci. 2007;8:451–465. - PubMed
    1. Bender KJ, Rangel J, Feldman DE. Development of columnar topography in the excitatory layer 4 to layer 2/3 projection in rat barrel cortex. J Neurosci. 2003;23:8759–8770. - PMC - PubMed
    1. Berkefeld H, Sailer CA, Bildl W, Rohde V, Thumfart JO, Eble S, Klugbauer N, Reisinger E, Bischofberger J, Oliver D, et al. BKCa-Cav channel complexes mediate rapid and localized Ca2+-activated K+ signaling. Science. 2006;314:615–620. - PubMed
    1. Bezanilla F, Armstrong CM. Inactivation of the sodium channel. I. Sodium current experiments. J Gen Physiol. 1977;70:549–566. - PMC - PubMed

Publication types

MeSH terms

LinkOut - more resources