Review
. 2009 Jun;11(6):1373-414.
doi: 10.1089/ars.2008.2331.

Mitochondrial reactive oxygen species production in excitable cells: modulators of mitochondrial and cell function

Affiliations
Review

Mitochondrial reactive oxygen species production in excitable cells: modulators of mitochondrial and cell function

David F Stowe et al. Antioxid Redox Signal. 2009 Jun.

Abstract

The mitochondrion is a major source of reactive oxygen species (ROS). Superoxide (O(2)(*-)) is generated under specific bioenergetic conditions at several sites within the electron-transport system; most is converted to H(2)O(2) inside and outside the mitochondrial matrix by superoxide dismutases. H(2)O(2) is a major chemical messenger that, in low amounts and with its products, physiologically modulates cell function. The redox state and ROS scavengers largely control the emission (generation scavenging) of O(2)(*-). Cell ischemia, hypoxia, or toxins can result in excess O(2)(*-) production when the redox state is altered and the ROS scavenger systems are overwhelmed. Too much H(2)O(2) can combine with Fe(2+) complexes to form reactive ferryl species (e.g., Fe(IV) = O(*)). In the presence of nitric oxide (NO(*)), O(2)(*-) forms the reactant peroxynitrite (ONOO(-)), and ONOOH-induced nitrosylation of proteins, DNA, and lipids can modify their structure and function. An initial increase in ROS can cause an even greater increase in ROS and allow excess mitochondrial Ca(2+) entry, both of which are factors that induce cell apoptosis and necrosis. Approaches to reduce excess O(2)(*-) emission include selectively boosting the antioxidant capacity, uncoupling of oxidative phosphorylation to reduce generation of O(2)(*-) by inducing proton leak, and reversibly inhibiting electron transport. Mitochondrial cation channels and exchangers function to maintain matrix homeostasis and likely play a role in modulating mitochondrial function, in part by regulating O(2)(*-) generation. Cell-signaling pathways induced physiologically by ROS include effects on thiol groups and disulfide linkages to modify posttranslationally protein structure to activate/inactivate specific kinase/phosphatase pathways. Hypoxia-inducible factors that stimulate a cascade of gene transcription may be mediated physiologically by ROS. Our knowledge of the role played by ROS and their scavenging systems in modulation of cell function and cell death has grown exponentially over the past few years, but we are still limited in how to apply this knowledge to develop its full therapeutic potential.


Figures

FIG. 1.
FIG. 1.
Schema of electron transfer through respiratory chain with sites of ROS (O2•−) generation at complexes I and III. Electron transfer is reversible, except at complex IV, and forward transfer results in extramatrix proton pumping at complexes I, III, and IV, with reentering of protons at complex V coupled to ATP synthesis. Succinate can lead to reverse electron transfer, reduction of NAD+ to NADH, and O2•− generation at complex I. [Used with permission and modified from Batandier et al. (22)].
FIG. 2.
FIG. 2.
(A) Sites of O2•− generation along electron-transport system with several respiratory inhibitors. (B) Diagram of electron-transport system with standard reduction potentials (Eo') of mobile components and ΔEo' where sufficient free energy is harvested to synthesize ATP.
FIG. 3.
FIG. 3.
The products of superoxide (O2•−) and their catalysts.
FIG. 4.
FIG. 4.
EPR spectra indicating formation of O2•− (DMPO-OH signals) by mitoplasts. The O2•− spin-trap DMPO and antimycin A (B) are necessary to observe the signals (Control; A), which are abolished by SOD (C). Succinate + antimycin A (D). [Reprinted with permission from Han et al. (152)].
FIG. 5.
FIG. 5.
Representative traces of H2O2 emission rates (amplex red, HRP) during 10 mM succinate–supported respiration in guinea pig heart isolated mitochondria. H2O2 emission was abrogated (A) by adding 4 μM carbonyl cyanide m-chlorophenylhydrazone (CCCP), a mitochondrial uncoupler, or by 4 μM rotenone (B), a complex I blocker. H2O2 emission during pyruvate (complex I substrate, 10 μM)-supported respiration (C). Catalase (300 U/ml) was added to scavenge the H2O2 generated, and 5 μM antimycin A (AA) was added to enhance the H2O2 generated at complex III. Note the lower rate of H2O2 emission with pyruvate than with succinate (reverse electron transfer). afu, arbitrary fluorescence units. Numbers are changes in afu/min. [Reprinted with permission from Heinen et al. (158)].
FIG. 6.
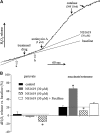
FIG. 6.
DHE (dihydroethidium) fluorescence (O2•−) during perfusion of guinea-pig isolated hearts at 37°C and 17°C with and without four drugs. Cardiac cooling markedly increased O2•− emission. MnTBAP, a SOD mimetic, reduced O2•− emission, and menadione (vitamin K3), an electron-transport inhibitor, increased O2•− emission, whereas BDM (butanedione monoxime), a contractile inhibitor, and L-NAME (NG-nitro-l-arginine methyl ester), an inhibitor of NO synthesis, had no effect on O2•− emission. DHE is thought to react with O2•− to form 2-OH-E+, which produces a transient red spectral shift. [Reprinted with permission from Camara et al. (71)].
FIG. 7.
FIG. 7.
Dityrosine (diTyr) fluorescence (ONOO) during perfusion of guinea-pig isolated hearts at 37°C and 17°C with and without four drugs. Cardiac cooling markedly increased ONOO. MnTBAP, a SOD mimetic, and L-NAME (NG-nitro-l-arginine methyl ester), an inhibitor of NO synthesis, both reduced ONOO, whereas menadione (vitamin K3), an electron-transport inhibitor, increased ONOO, and BDM (butanedione monoxime), a contractile inhibitor, had no effect on ONOO. [Reprinted with permission from Camara et al. (71)].
FIG. 8.
FIG. 8.
Schema of proposed O2•− generation sites in complex I at FMN (flavin), Fe-S centers N1–N5, and/or Q binding sites (A–C, circles). Electron transport can be forward (solid arrow) or reverse (dashed arrow); O2•− release is into the matrix only. SDH, succinate dehydrogenase. [Used with permission of and modified from Brand et al. (48)].
FIG. 9.
FIG. 9.
Model of O2•− generation during forward (top) and reverse (bottom) electron transfer within complex I. During forward transport (substrate pyruvate), e are passed from NADH to Q in a quinone-reducing site via the FMN and Fe-S centers. The resulting QH is reduced in a ΔpH-dependent generating step to form QH2 with another e from QH2 or QH at the quinol oxidation site. O2•− generation is low unless Q-site inhibitors are present and the ΔpH is large. During reverse transport (substrate succinate), e are passed from QH2 to NAD, so that the pool is reduced to NADH. A large ΔpH drives the formation of QH, which loses its unpaired e to O2 because all redox centers upstream of Q are fully reduced. [Used with permission of and modified from Lambert and Brand (200)].
FIG. 10.
FIG. 10.
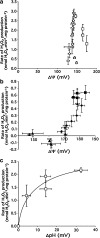
H2O2 production is more dependent on mitochondrial ΔpH than on ΔΨm during reverse electron transfer at complex I. This is suggested by the dependence of H2O2 production on ΔΨm when ΔpH is present (a) or absent (b); the difference (c) represents H2O2 production as a function of ΔpH. ΔpH was abolished with nigericin (b), which converts any ΔpH into ΔΨm. [Reprinted with permission from Lambert and Brand (201)].
FIG. 11.
FIG. 11.
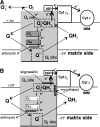
Mechanisms of O2•− formation from complex III. Oxidation of quinol (QH2) results in transfer of a single e to a high-reduction-potential chain at the Qo (extramatrix) site containing the Fe-S protein (ISP, Rieske protein) and on to cytochrome c1 and cytochrome c, and finally to cytochrome c oxidase. The remaining QH is unstable and donates the second e to a low-reduction-potential chain consisting of cytochrome bl (low) and bh (high), leading the e toward the Qi (matrix) site to form a stable QH; this QH is then reduced to QH2 by a subsequent e passed along the low-reduction-potential chain, thereby completing the Q–QH2–Q cycle. In (A), antimycin A causes extramatrix release of O2•−; in (B), stigmatellin and myxothiazol block antimycin A from releasing O2•−. [Used with permission of and modified from Andreyev et al. (8)].
FIG. 12.
FIG. 12.
Highly reduced and coupled mitochondria (high ΔΨm and limited respiration due to lack of ADP) leak e for attack by O2 because QH is not as rapidly reduced to QH2. Progressive uncoupling by using a protonophore (SF6847) gradually reduces ΔΨm and increases respiration while markedly preventing H2O2 generation. A similar effect occurs during state 3 with added ADP. [Reprinted with permission from Korshunov et al. (191)].
FIG. 13.
FIG. 13.
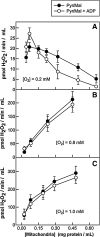
Isolated mitochondria can produce H2O2 during state 3 (ADP stimulated) as well as during state 4 conditions during forward electron flow, provided that [O2] and mitochondrial protein concentration are sufficient. [Reprinted with permission from Saborido et al. (276)].
FIG. 14.
FIG. 14.
ROS production at complex I in cardiac mitochondria is critically dependent on a highly reduced NADH pool. Downstream inhibition of electron transfer (respiration) by rotenone leads to reduction of all upstream carriers and results in e leak and ROS generation. Note the large decrease in respiration rate and the increasingly reduced redox state with rotenone associated with ROS production during state 3 (left) compared with state 4 (right). [Reprinted with permission from Kushnareva et al. (199)].
FIG. 15.
FIG. 15.
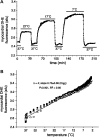
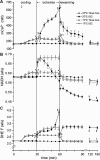
DHE (dihydroethidium) fluorescence (O2•− emission) increases during perfusion of guinea-pig isolated hearts during intermittent (A) and continuous (B) cooling from 37°C to 2°C. The increase in O2•− emission with cooling likely results both from increased O2•− generation and decreased O2•−-scavenging capability by MnSOD. Afu, arbitrary fluorescence units. [Reprinted with permission from Camara et al. (71)].
FIG. 16.
FIG. 16.
Temporal relation between ΔΨm (TMRM fluorescence) and ROS (DCF fluorescence) in a cardiac myocyte. “Trigger” ROS was induced by photoactivation of TMRM derivatives. Note the burst of ROS after photoexcitation by laser scanning caused a decrease in ΔΨm, which was assumed to be a result of ROS-induced MPT opening. [Reprinted with permission from Zorov et al. (336)].
FIG. 17.
FIG. 17.
Averaged mitochondrial [Ca2+] (A), NADH (B), and DHE (O2•−) (C) in four groups of guinea-pig isolated hearts over time. Groups are time control versus 30-min global ischemia (isc) at 37°C versus 17°C. Note the increases in mitochondrial [Ca2+] and O2•−, while NADH decreases, during later ischemia. Variables were measured in the left ventricle with a trifurcated fiberoptic probe and differential fluorescence spectrophotometry. [Reprinted with permission from Riess et al. (269)].
FIG. 18.
FIG. 18.
Averaged DHE (O2•−) (A) and mitochondrial [Ca2+] (B), in five groups of guinea-pig isolated hearts over time. Groups are 30-min global ischemia control and preischemia treatments with MnTBAP, catalase + glutathione (CG), MnTBAP + CG (MCG), and l-NAME. Note that the MnTBAP-treated group exhibited the largest increase in [Ca2+], whereas the MCG-treated group exhibited the smallest increases in [Ca2+] and O2•−. [Reprinted with permission from Camara et al. (70)].
FIG. 19.
FIG. 19.
Averaged ETH (DHE) fluorescence (O2•−) in four groups of guinea-pig isolated hearts over time. Note that the increase in O2•− during brief global ischemia (IPC, ischemic preconditioning) was attenuated by MnTBAP and that MnTBAP also blocked the reduction in O2•− afforded by IPC so that O2•− increased to the level of the ischemia control. [Reprinted with permission from the publisher of Kevin et al. (181)].
FIG. 20.
FIG. 20.
Dependence of H2O2 production during state 3 (A) and state 4 (B) on [O2] in mitochondria isolated from rat liver. Note that at <5 μM [O2], H2O2 production decreased toward zero. Experiments were conducted in the presence of succinate + rotenone and oligomycin (state 4 only). [Reprinted with permission from Hoffman et al. (161)].
FIG. 21.
FIG. 21.
Schema of glutaredoxin and thioredoxin buffering system in the mitochondrion. Glutathione is transported across the outer membrane (OM) via porin into the intermembrane space (IMS) and across the inner membrane (IM) via a transporter (trans) to the matrix. Other redox proteins are transported via the TOM and TIM23 complexes. The glutaredoxin and thioredoxin reactions in the matrix repair oxidatively damaged proteins. [Used with permission and modified from Koehler et al. (189)].
FIG. 22.
FIG. 22.
Pathways of reactive O2 metabolism. O2•− and H2O2 exert protective effects on the cell via signaling pathways for preconditioning via phosphorylation products and via oxidant-induced gene products that activate multiple groups of proteins. Severe hypoxia, ischemia and reperfusion, and toxins can cause excessive oxidant stress that leads to cell-damaging effects of ferryl radicals such as Fe(IV) = O. [Used with permission and modified from Becker (27)].
FIG. 23.
FIG. 23.
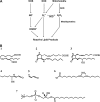
Pathways of NO, O2•−, and HO and their reactive lipid products, including lipid peroxides (1), 15-deoxy-Δ12,14-protaglandin J2 (2), isoprostane J2 (3), 4-hydroxynonenal (4-HNE) (4), acrolein (5), nitrolinoleic acid (6), and lysoPC (7). [Used with permission and modified from Zmijewski et al. (334)].
FIG. 24.
FIG. 24.
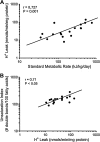
Correlations between mitochondrial H+ leak, metabolic rate, and membrane fatty acid polyunsaturation in liver mitochondria. [Reprinted with permission from Brookes (55)].
FIG. 25.
FIG. 25.
Assessment of proton leak from the downward shift in the ΔΨm versus respiratory-rate curve after IPC + ischemia versus ischemia alone (IR); no ischemia is control (CON). Note the decrease in respiration after IPC compared with IR at 160 mV (insert), indicating less proton leak. Data from rat mitochondria isolated at 30 min of reperfusion after ischemia. [Reprinted with permission from Nadtochiy et al. (238)].
FIG. 26.
FIG. 26.
The K+ cycle in heart mitochondria. In this model, electrophoretic matrix K+ influx (leak) is matched by electrogenic H+ efflux (ETS), and K+ influx via KATP and Kca channels is matched by K+ efflux and H+ influx via KHE (K+/H+). The H+ influx is accompanied by phosphate influx (Pi); a net uptake of phosphoric acid and salt occurs, so that matrix swelling occurs. Finally, matrix alkalinization releases the KHE from allosteric inhibition by protons, and its activity increases to match K+ influx. [Used with permission and modified from Costa et al. (95)].
FIG. 27.
FIG. 27.
Small increases in O2•− generation assessed by DHE fluorescence (ETH) in isolated hearts during treatment with the anesthetic sevoflurane (Sevo) (A) were blocked by the SOD mimetic MnTBAP (C, D) but not by the KATP channel inhibitor 5-HD (B, D). [Reprinted with permission from Kevin et al. (182)].
FIG. 28.
FIG. 28.
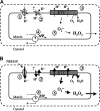
Proposed effect of submaximal K+ influx with mBKCa channel opening (1) on proton leak (2), proton ejection and respiration (3), ΔΨm (4) and generation of O2•-and H2O2 (5). Net effect of mBKCa channel opening (B) (vs. closed, A) would be to accelerate electron flux without a change in ΔΨm due to support by proton leak; maintained ΔΨm and higher electron flow would accelerate ROS generation. [Reprinted with permission from Heinen et al. (159)].
FIG. 29.
FIG. 29.
Mitochondrial H2O2 release rate from heart isolated mitochondria. (A) Representative trace for 30 μM NS-1619–induced increase in cumulative H2O2 release with succinate + rotenone as substrate. Maximal ROS production was stimulated in some experiments by adding complex III blocker antimycin A (5 μM). Catalase (300 U/ml) was added to confirm H2O2 production. Open arrow a, baseline; open arrow b, treatment effect. (B) Summary of H2O2 release rates. All treatment effects are compared with baseline of the same experiment. [Reprinted with permission from Heinen et al. (159)].
FIG. 30.
FIG. 30.
ROS production (Cbx-DCF fluorescence) in rat-heart mitochondria over time after adding (before time zero) valinomycin (Val), diazoxide (Dzy), and 5-hydroxydecanoate (5-HD) singly or together with ATP to maintain state 4 (A). ROS production was obtained from the initial slopes of traces such as those shown in (A) and plotted as percentage ATP-inhibited control rate obtained in the absence of drug. Adding ROS scavenger N-(2-mercaptopropyonyl)glycine (MPG) decreased ROS production in the presence of Dzy and Val ∼10-fold (B). [Reprinted with permission from Andrukhiv et al. (9)].
FIG. 31.
FIG. 31.
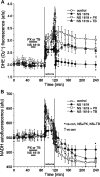
Effects of BKCa channel opener NS1619 on attenuating O2•− emission (A) and NADH (B) during ischemia and reperfusion in guinea-pig isolated hearts were largely reversed by BKCa channel blocker paxilline (PX) or by SOD mimetic MnTBAP (TB). *p < 0.05 vs. Con, NS + PX, NS + TB. [Reprinted with permission from Stowe et al. (298)].
FIG. 32.
FIG. 32.
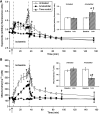
Effect of reversible complex I inhibitor amobarbital on O2•− generation (DHE fluorescence) (A) and mitochondrial [Ca2+] (B) during ischemia and reperfusion in guinea-pig isolated hearts. Arrow, 1-min amobarbital perfusion immediately before ischemia. Inset: Effect of amobarbital before ischemia on O2•− emission and [Ca2+]. White and hatched bars, baseline and 1 min of treatment, respectively. [Reprinted with permission from Aldakkak et al. (5)].
FIG. 33.
FIG. 33.
Electrons derived from reducing equivalents are transferred through the respiratory system to complex IV where 4e are transferred to O2. During hypoxia, this transfer is slowed, even though sufficient O2 exists to function as the electron acceptor. The resulting buildup of electrons and NADH may set up a condition for electron leak to O2, partially bypassing complex IV. [Used with permission of and modified from Chandel and Schumacker (80)].
FIG. 34.
FIG. 34.
Effect of H2O2 on TCA cycle and products of 2-oxo acid nonenzymatic oxidation on metabolism (A) and signaling (B). (A) Pyruvate (PYR), α-ketoglutarate (KGL), and oxaloacetate (OA) are decarboxylated by H2O2 to form acetate, succinate, and malonate (broken line) nonenzymatically instead of acetyl-CoA (acCoA), succinyl-CoA (sucCoA), and malate (MAL), or phosphoenolpyruvate (PEP) formed enzymatically (solid line) and are used to synthesize fatty acids, cholesterol, and glucose. ROS inhibit the TCA cycle mainly at aconitase and α-ketoglutarate dehydrogenase (KGDH) (thick arrow). The truncated Krebs cycle instead of the omitted steps of citric acid (citrate, CIT; cis-aconitate, cAC; isocitrate, ISC) is closed by transamination of OA with glutamate (GLU), which leads to formation of KGL and aspartate (ASP). As a part of the malate/aspartate shunt, these substrates enter the cytosol where OA is formed by transaminase from ASP or citrate lyase from citrate. (B) HIF-1α degrades in cells at normal O2 levels after prolyl residue hydroxylation by O2/KGL/Fe(II)-dependent hydroxylase. Hypoxia, succinate, and KGL decarboxylation by H2O2, which leads to decreased KGL and increased succinate, inhibits the enzyme, permitting transport of HIF-1α to the nucleus and HIF-dependent transcription of a wide variety of genes responsible for O2 transport, vascularization, and anaerobic energy production. [Used with permission of and modified from Fedotcheva et al. (121)].

References

    1. Akao M. O'Rourke B. Teshima Y. Seharaseyon J. Marban E. Mechanistically distinct steps in the mitochondrial death pathway triggered by oxidative stress in cardiac myocytes. Circ Res. 2003;92:186–194. - PubMed
    1. Alberts B. Johnson A. Lewis J. Raff M. Roberts K. Walter P. Molecular biology of the cell. New York: Garland Publishing; 1994.
    1. Aldakkak M. Camara AKS. Beard DA. Dash RK. Huang M. Stowe DF. NS1619 increases potassium influx in the isolated intact mitochondrion in a dose-dependent manner [Abstract] Biophys J. 2007:pos–441.
    1. Aldakkak M. Camara AKS. Patel R. Haumann J. Rhodes SS. Stowe DF. Inactivation of cardiac mitochondrial K/H exchange by quinine exposes matrix acidification and K+ influx by putative Ca2+-dependent K+ channels [Abstract] J Biophysics. 2008:436–pos.
    1. Aldakkak M. Stowe DF. Chen Q. Lesnefsky EJ. Camara AK. Inhibited mitochondrial respiration by amobarbital during cardiac ischaemia improves redox state and reduces matrix Ca2+ overload and ROS release. Cardiovasc Res. 2008;77:406–415. - PubMed

Publication types

LinkOut - more resources