Comparative Study
. 2008 Dec;37 Suppl 2(Suppl 2):33-45.
doi: 10.1111/j.1600-0684.2008.00323.x.

Kinetics of T lymphocyte apoptosis and the cellular immune response in SIVmac239-infected rhesus macaques

Affiliations
Comparative Study

Kinetics of T lymphocyte apoptosis and the cellular immune response in SIVmac239-infected rhesus macaques

Mareike Meythaler et al. J Med Primatol. 2008 Dec.

Abstract

Background: Although increased apoptosis is a central feature of AIDS, little is known about its kinetics or relationship to the early host response in acute HIV/SIV infection.

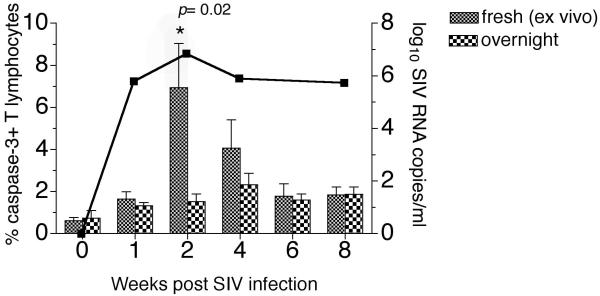
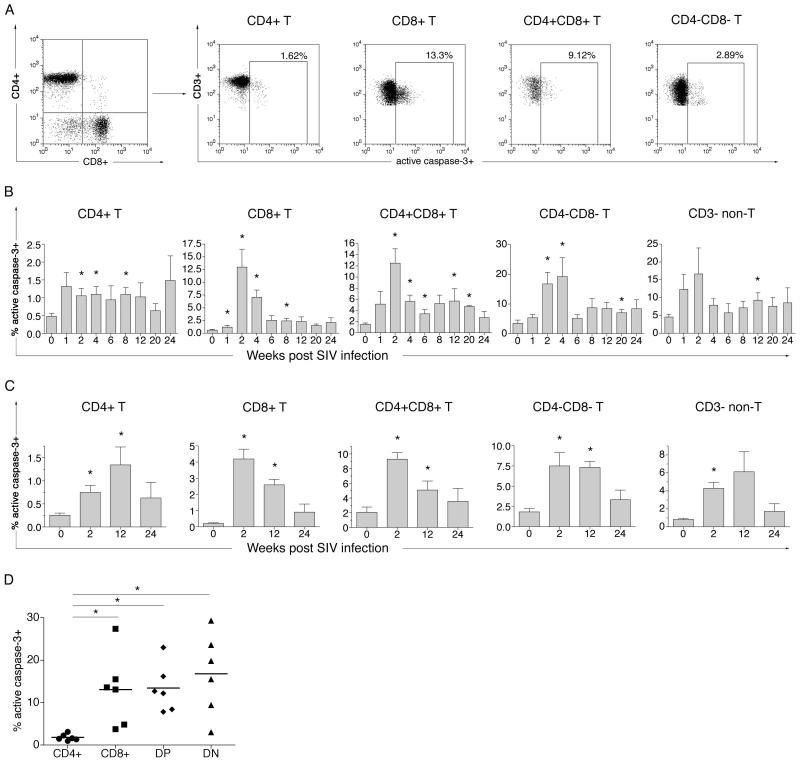
Methods: Ex vivo apoptosis in freshly isolated peripheral blood and lymph node lymphocytes was monitored longitudinally in SIVmac239-infected rhesus macaques by flow-cytometric detection of active caspase-3, cleaved poly (ADP-ribose) polymerase, and fragmented DNA.

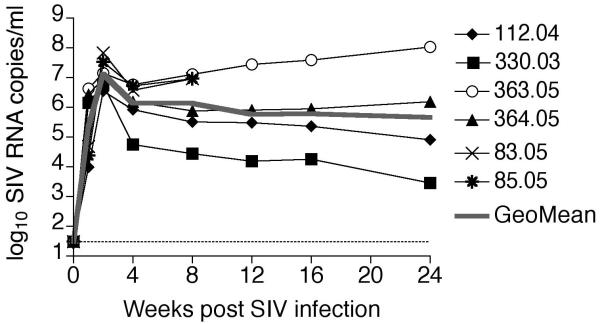
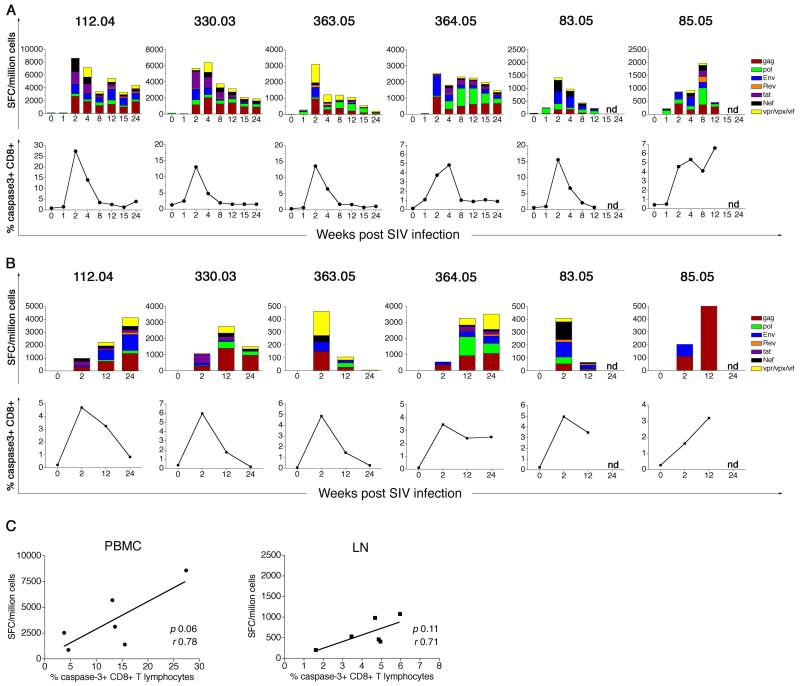
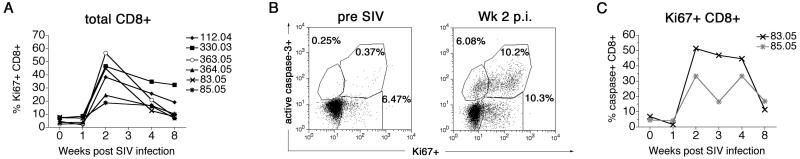
Results: Increased apoptosis of multiple lymphocyte subsets was observed in the first 2 weeks following SIV infection. Apoptosis of CD4+ T lymphocytes was of low magnitude but peaked earlier than other T lymphocyte subsets. A 10- to 36-fold increase in CD8+ T lymphocyte apoptosis coincided temporally with onset of the SIV-specific cellular immune response and enrichment of caspase-3-positive cells within recently proliferating, activated CD8+ T lymphocytes.

Conclusions: The virus-specific T lymphocyte response to primary infection and generalized non-specific immune activation contribute to the pathogenesis of apoptosis in acute SIV infection.


Figures

Figure 1
Figure 1. Kinetics of SIVmac239 viremia in six experimentally infected rhesus macaques
Plasma SIV RNA levels in six SIVmac239-infected rhesus macaques determined by real time PCR are shown. Rhesus macaques 83.05 and 85.05 were only followed until eight weeks post SIV infection. The grey line represents the geometric mean of the viral loads. The limit of detection of the assay denoted by the dotted line was 30 SIV RNA copies/ml plasma.
Figure 2
Figure 2. Comparison of apoptosis in freshly isolated versus cultured lymphocytes in relation to plasma viremia in acute SIV infection
Longitudinal analysis of the frequency of caspase-3-positive T lymphocytes detected in freshly isolated lymphocytes (fresh, ex vivo) and following 18 hours in vitro culture without any additional stimuli (overnight). Columns and error bars represent the mean and standard error of mean (SEM) values obtained in four animals. Asterisk denotes significant differences between the two methods of apoptosis detection calculated by the paired t-test. The solid overlay line represents the geometric mean plasma SIV RNA viral load in the four animals.
Figure 3
Figure 3. Comparison of active caspase-3, cleaved PARP, and TUNEL for detection of T lymphocyte apoptosis in SIV-infected rhesus macaques
(A) Representative flow plots of CD3+ T lymphocytes stained for TUNEL-positive cells (on the left), active caspase-3-positive cells (in the middle) and cleaved PARP-positive cells, including PARP and caspase-3 colocalization (on the right). Data are shown for pre-SIV and two weeks post SIV infection time-points in one rhesus macaque. (B) Kinetics of active caspase-3-, TUNEL- and cleaved PARP-positive T lymphocytes following SIVmac239 infection. Data on two rhesus macaques, 83.05 (on the left) and 85.05 (on the right) are shown. (C) Correlation between active caspase-3-positive and TUNEL-positive T lymphocytes (on the left) and between active caspase-3-positive and cleaved PARP-positive T lymphocytes (on the right). Data on peripheral blood and lymph node of two SIVmac239-infected rhesus macaques shown. Correlation analysis was performed with the Pearson test. “p.i.” – post-infection
Figure 4
Figure 4. Increase in apoptosis of T and non-T lymphocyte subsets following SIVmac239 infection
(A) Representative flow cytometric analysis of active caspase-3 in freshly isolated T lymphocyte subsets at week two post SIV infection. Lymphocytes gated on CD3+ T lymphocyte were analyzed for intracellular expression of active caspase-3 on CD4+, CD8+, CD4+CD8+ (DP) and CD4−CD8− (DN) T lymphocytes. (B) Longitudinal analysis of apoptosis in peripheral blood lymphocytes. Percentage caspase-3-positive cells prior to and at different time-points following SIV infection are shown for T lymphocyte subsets and CD3− non-T lymphocytes. (C) Longitudinal analysis of apoptosis of T lymphocyte subsets and CD3− non-T lymphocytes in the peripheral lymph node. Time-points pre SIV, and at weeks two, 12 and 24 post SIV infection are shown. Columns and error bars represent the mean and SEM values of six (weeks 0 to12) or four (weeks 16 to 24) rhesus macaques. Asterisks denote significant differences (P value <0.05) between pre-SIV and post-SIV infection time-points determined by the two-tailed paired t-test. (D) Comparison of maximal frequency of apoptotic cells in different T lymphocyte subsets in the first four weeks post SIV infection. Asterisks denotes significant differences (P value <0.05) between T lymphocytes subsets determined by the one way AVOVA Kruskal-Wallis and Dunn’s post test.
Figure 5
Figure 5. SIV-specific IFN-γ ELISPOT responses and CD8+ T lymphocyte apoptosis in SIVmac239-infected rhesus macaques
(A) Kinetics of peripheral blood SIV-specific IFN-γ ELISPOT responses (top panel) and CD8+ T lymphocyte apoptosis (bottom panel) for the first 24 weeks following SIV infection. (B) Kinetics of peripheral lymph node SIV-specific IFN-γ ELISPOT responses (top panel) and CD8+ T lymphocyte apoptosis (bottom panel) for the first 24 weeks following SIV infection. Data on individual SIVmac239-infected rhesus macaques shown. (C) Relationship between the magnitude of the SIV-specific IFN-γ ELISPOT response and frequency of active caspase-3-positive CD8+ T lymphocytes at two weeks post SIV infection in PBMC (left panel) and lymph node (right panel). Correlation analysis was performed with the Pearson test. SFC: Spot forming cells
Figure 6
Figure 6. Relationship between intracellular Ki67 antigen and active caspase-3 expression in CD8+ T lymphocytes following SIVmac239 infection
(A) Kinetics of activated Ki67-positive CD8+ T lymphocytes in six SIVmac239-infected rhesus macaques. (B) Representative flow analysis demonstrating co-localization of Ki67 antigen and active caspase-3 on CD8+ T lymphocytes prior to and two weeks post SIV infection. (C) Frequency of active caspase-3-positive cells within Ki67-positive CD8+ T lymphocytes in the first eight weeks following SIVmac239 infection. Data on rhesus macaques 83.05 and 85.05 shown. “p.i.” – post-infection

Similar articles

Cited by

References

    1. Adrain C, Martin SJ. The mitochondrial apoptosome: a killer unleashed by the cytochrome seas. Trends Biochem Sci. 2001;26:390–7. - PubMed
    1. Alam A, Cohen LY, Aouad S, Sekaly RP. Early activation of caspases during T lymphocyte stimulation results in selective substrate cleavage in nonapoptotic cells. J Exp Med. 1999;190:1879–90. - PMC - PubMed
    1. Alimonti JB, Ball TB, Fowke KR. Mechanisms of CD4+ T lymphocyte cell death in human immunodeficiency virus infection and AIDS. J Gen Virol. 2003;84:1649–61. - PubMed
    1. Anonymous . Guide for care and use of laboratory animals. Institute of Laboratory Animal Resources, National Council; Washington, D.C.: 1996. pp. 86–123.
    1. Appay V, Papagno L, Spina CA, Hansasuta P, King A, Jones L, Ogg GS, Little S, McMichael AJ, Richman DD, Rowland-Jones SL. Dynamics of T cell responses in HIV infection. J Immunol. 2002;168:3660–6. - PubMed

Publication types