

Mortality profiles in a country facing epidemiological transition: an analysis of registered data
- PMID: 19187553
- PMCID: PMC2640471
- DOI: 10.1186/1471-2458-9-47
Mortality profiles in a country facing epidemiological transition: an analysis of registered data
Abstract
Background: Sub-national analyses of causes of death and time-trends help to define public health policy priorities. They are particularly important in countries undergoing epidemiological transition like Peru. There are no studies exploring Peruvian national and regional characteristics of such epidemiological transition. We aimed to describe Peru's national and regional mortality profiles between 1996 and 2000.
Methods: Registered mortality data for the study period were corrected for under-registration following standardized methods. Main causes of death by age group and by geographical region were determined. Departmental mortality profiles were constructed to evaluate mortality transition, using 1996 data as baseline. Annual cumulative slopes for the period 1996-2000 were estimated for each department and region.
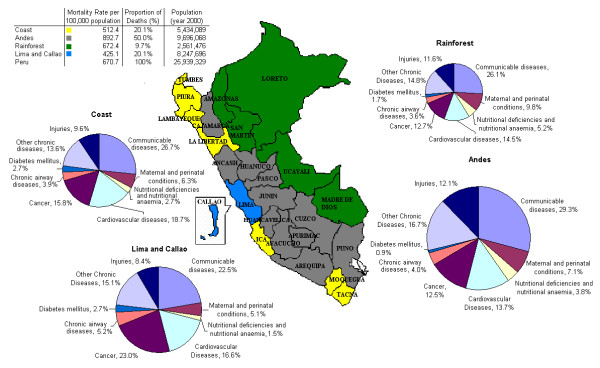
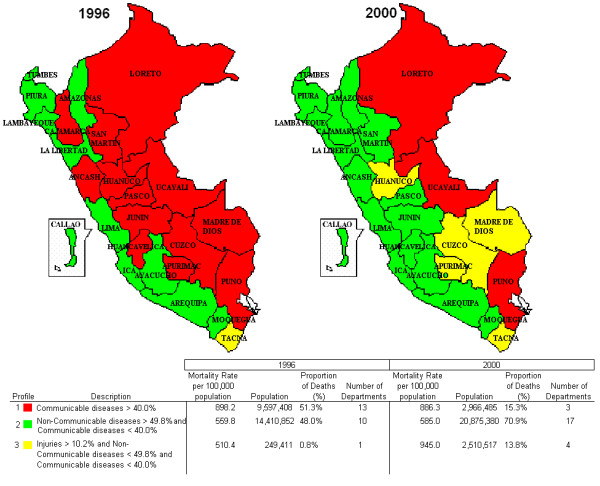
Results: For the study period non-communicable diseases explained more than half of all causes of death, communicable diseases more than one third, and injuries 10.8% of all deaths. Lima accounted for 32% of total population and 20% of total deaths. The Andean region, with 38% of Peru's population, accounted for half of all country deaths. Departmental mortality predominance shifted from communicable diseases in 1996 towards non-communicable diseases and injuries in 2000. Maternal and perinatal conditions, and nutritional deficiencies and nutritional anaemia declined markedly in all departments and regions. Infectious diseases decreased in all regions except Lima. In all regions acute respiratory infections are a leading cause of death, but their proportion ranged from 9.3% in Lima and Callao to 15.3% in the Andean region. Tuberculosis and injuries ranked high in Lima and the Andean region.
Conclusion: Peruvian mortality shows a double burden of communicable and non-communicable, with increasing importance of non-communicable diseases and injuries. This challenges national and sub-national health system performance and policy making.
Figures


References
-
- Lopez AD, Mathers CD, Ezzati M, Jamison DT, Murray CJL. Global burden of disease and risk factors. New York: Oxford University Press; 2006. - PubMed
-
- Bloom B, Michaud C, La Montagne J, Simonsen L. Priorities for Global Research and Development of Interventions. In: Jamison DT, Breman JG, Measham AR, et al, editor. Disease Control Priorities in Developing Countries. New York: Oxford University Press; 2006. pp. 103–118.
-
- World Health Organization . World Health Statistics 2006. Geneva: World Health Organization; 2006.
Publication types
MeSH terms
Grants and funding
LinkOut - more resources
Full Text Sources
Medical
