

Protective effect of perindopril on diabetic retinopathy is associated with decreased vascular endothelial growth factor-to-pigment epithelium-derived factor ratio: involvement of a mitochondria-reactive oxygen species pathway
- PMID: 19188429
- PMCID: PMC2661575
- DOI: 10.2337/db07-1524
Protective effect of perindopril on diabetic retinopathy is associated with decreased vascular endothelial growth factor-to-pigment epithelium-derived factor ratio: involvement of a mitochondria-reactive oxygen species pathway
Abstract
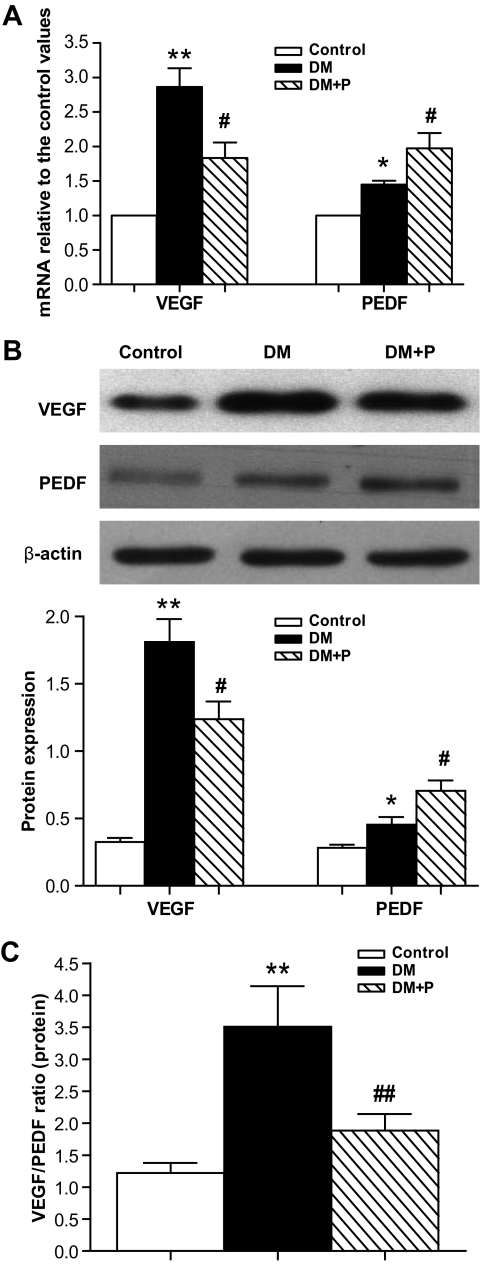
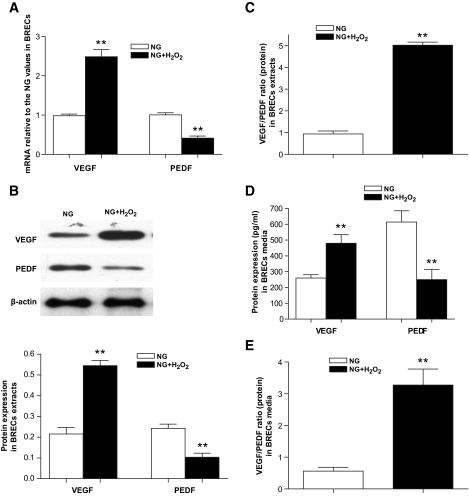
Objective: This study aimed to verify whether the decreased vascular endothelial growth factor (VEGF)-to-pigment epithelium-derived factor (PEDF) ratio can serve as an indicator for the protective effect of angiotensin-converting enzyme inhibitors (ACEIs) on diabetic retinopathy (DR) and to investigate the role of mitochondrial reactive oxygen species (ROS) in the downregulated VEGF-to-PEDF ratio.
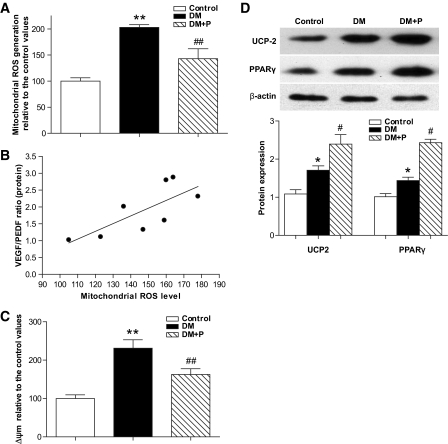
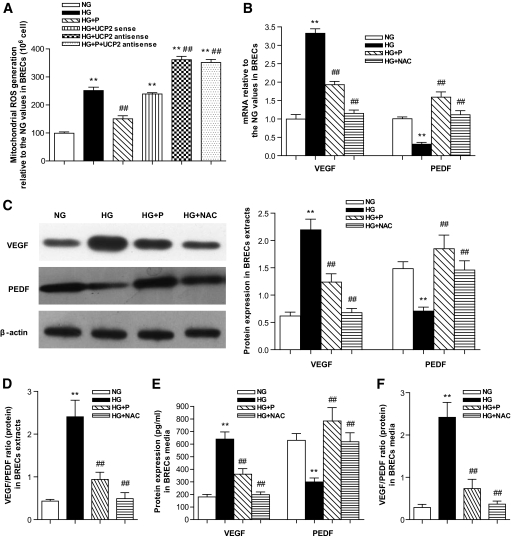
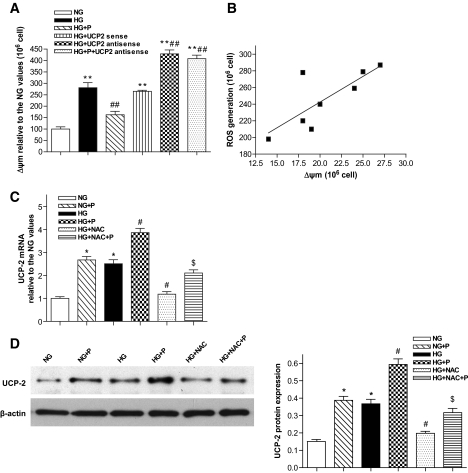
Research design and methods: Diabetic rats and control animals were randomly assigned to receive perindopril or vehicle for 24 weeks, and bovine retinal capillary endothelial cells (BRECs) were incubated with normal or high glucose with or without perindopril. VEGF, PEDF, PPARgamma, and uncoupling protein-2 (UCP-2) in the rat retinas or BREC extracts were examined by Western blotting and real-time RT-PCR. The levels of VEGF and PEDF in cell culture media were examined by ELISA. Mitochondrial membrane potential (Deltapsim) and ROS production were assayed using JC-1 or CM-H2DCFDA.
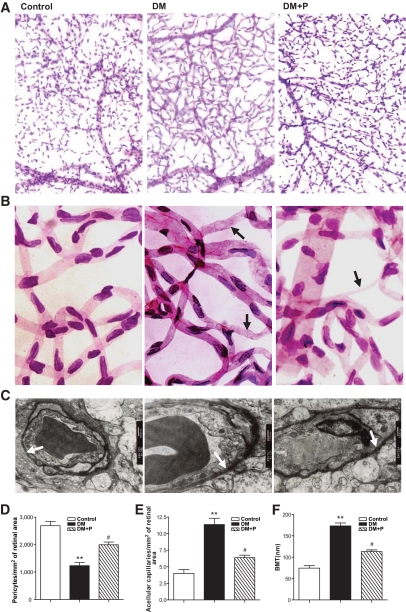
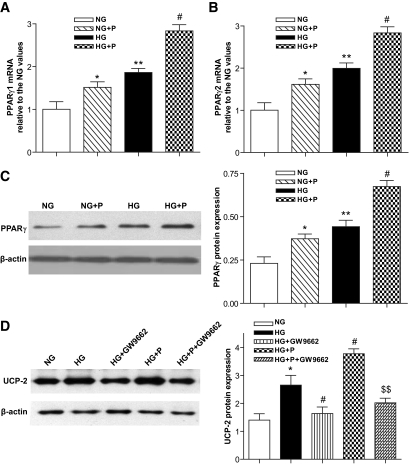
Results: The VEGF-to-PEDF ratio was increased in the retina of diabetic rats; perindopril lowered the increased VEGF-to-PEDF ratio in diabetic rats and ameliorated the retinal damage. In BRECs, perindopril lowered the hyperglycemia-induced elevation of VEGF-to-PEDF ratio by reducing mitochondrial ROS. We found the decreased ROS production was a result of perindopril-induced upregulation of PPARgamma and UCP-2 expression and the subsequent decrease of Deltapsim.
Conclusions: It is concluded that the protective effect of ACEI on DR is associated with a decreased VEGF-to-PEDF ratio, which involves the mitochondria-ROS pathway through PPARgamma-mediated changes of UCP-2. This study paves a way for future application of ACEI in treatment of DR.
Figures
Similar articles
-
Inhibition of JAK2/STAT3-mediated VEGF upregulation under high glucose conditions by PEDF through a mitochondrial ROS pathway in vitro.Invest Ophthalmol Vis Sci. 2010 Jan;51(1):64-71. doi: 10.1167/iovs.09-3511. Epub 2009 Aug 20. Invest Ophthalmol Vis Sci. 2010. PMID: 19696171
-
Improvement of retinal vascular injury in diabetic rats by statins is associated with the inhibition of mitochondrial reactive oxygen species pathway mediated by peroxisome proliferator-activated receptor gamma coactivator 1alpha.Diabetes. 2010 Sep;59(9):2315-25. doi: 10.2337/db10-0638. Epub 2010 Jun 21. Diabetes. 2010. PMID: 20566666 Free PMC article.
-
Pigment epithelium-derived factor inhibits advanced glycation end product-induced retinal vascular hyperpermeability by blocking reactive oxygen species-mediated vascular endothelial growth factor expression.J Biol Chem. 2006 Jul 21;281(29):20213-20. doi: 10.1074/jbc.M602110200. Epub 2006 May 17. J Biol Chem. 2006. PMID: 16707486
-
Signaling Mechanisms Involved in PEDF-Mediated Retinoprotection.Adv Exp Med Biol. 2019;1185:445-449. doi: 10.1007/978-3-030-27378-1_73. Adv Exp Med Biol. 2019. PMID: 31884652 Free PMC article. Review.
-
Alteration of growth factors and neuronal death in diabetic retinopathy: what we have learned so far.Mol Vis. 2011 Jan 28;17:300-8. Mol Vis. 2011. PMID: 21293735 Free PMC article. Review.
Cited by
-
The involvement of the mGluR5-mediated JNK signaling pathway in rats with diabetic retinopathy.Int Ophthalmol. 2019 Oct;39(10):2223-2235. doi: 10.1007/s10792-018-01061-w. Epub 2019 Jan 3. Int Ophthalmol. 2019. PMID: 30607864
-
Vitamin D3 Protects against Diabetic Retinopathy by Inhibiting High-Glucose-Induced Activation of the ROS/TXNIP/NLRP3 Inflammasome Pathway.J Diabetes Res. 2018 Feb 22;2018:8193523. doi: 10.1155/2018/8193523. eCollection 2018. J Diabetes Res. 2018. PMID: 29682582 Free PMC article.
-
Stage-dependent proteomic alterations in aqueous humor of diabetic retinopathy patients based on data-independent acquisition and parallel reaction monitoring.J Transl Med. 2025 Apr 25;23(1):476. doi: 10.1186/s12967-025-06452-z. J Transl Med. 2025. PMID: 40281624 Free PMC article.
-
Novel drugs and their targets in the potential treatment of diabetic retinopathy.Med Sci Monit. 2013 Apr 26;19:300-8. doi: 10.12659/MSM.883895. Med Sci Monit. 2013. PMID: 23619778 Free PMC article. Review.
-
A five-year prospective study of diabetic retinopathy progression in chinese type 2 diabetes patients with "well-controlled" blood glucose.PLoS One. 2015 Apr 7;10(4):e0123449. doi: 10.1371/journal.pone.0123449. eCollection 2015. PLoS One. 2015. PMID: 25849536 Free PMC article.
References
-
- Ferris FL, 3rd, Davis MD, Aiello LM: Treatment of diabetic retinopathy. N Engl J Med 341: 667– 678, 1999 - PubMed
-
- Chaturvedi N, Sjolie AK, Stephenson JM, Abrahamian H, Keipes M, Castellarin A, Rogulja-Pepeonik Z, Fuller JH: Effect of lisinopril on progression of retinopathy in normotensive people with type 1 diabetes. The EUCLID Study Group. EURODIAB Controlled Trial of Lisinopril in Insulin-Dependent Diabetes Mellitus. Lancet 351: 28– 31, 1998 - PubMed
-
- Neroev VV, Riabina MV, Okhotsimskaia TD, Zueva MV, Tsapenko IV: Use of perindopril in the treatment of patients with diabetic retinopathy. Vestn Oftalmol 122: 31– 33, 2006 - PubMed
-
- Gilbert RE, Kelly DJ, Cox AJ, Wilkinson-Berka JL, Rumble JR, Osicka T, Panagiotopoulos S, Lee V, Hendrich EC, Jerums G, Cooper ME: Angiotensin converting enzyme inhibition reduces retinal overexpression of vascular endothelial growth factor and hyperpermeability in experimental diabetes. Diabetologia 43: 1360– 1367, 2000 - PubMed
-
- Hogeboom van Buggenum IM, Polak BC, Reichert-Thoen JW, de Vries-Knoppert WA, van Hinsbergh VW, Tangelder GJ: Angiotensin converting enzyme inhibiting therapy is associated with lower vitreous vascular endothelial growth factor concentrations in patients with proliferative diabetic retinopathy. Diabetologia 45: 203– 209, 2002 - PubMed
Publication types
MeSH terms
Substances
LinkOut - more resources
Full Text Sources
Medical
Miscellaneous
