. 2009 May;58(5):1116-25.
doi: 10.2337/db08-1129. Epub 2009 Feb 2.

Prenatal stress or high-fat diet increases susceptibility to diet-induced obesity in rat offspring

Affiliations

Prenatal stress or high-fat diet increases susceptibility to diet-induced obesity in rat offspring

Kellie L K Tamashiro et al. Diabetes. 2009 May.

Abstract

Objective: Perturbations to the prenatal environment have been associated with the development of adult chronic disease, findings that gave rise to the "Barker Hypothesis" or the "developmental origins of adult disease" concept. In this study, we used an animal model to determine the metabolic consequences of maternal prenatal stress and high-fat feeding on the developing offspring.

Research design and methods: Pregnant female Sprague-Dawley rats were maintained on standard chow or 60% high-fat diet throughout gestation and lactation. Half of each group were exposed to a novel variable stress paradigm during the 3rd week of gestation, whereas control dams were left undisturbed. Body weight, body composition, glucose tolerance, and endocrine parameters were measured in offspring through early adulthood.

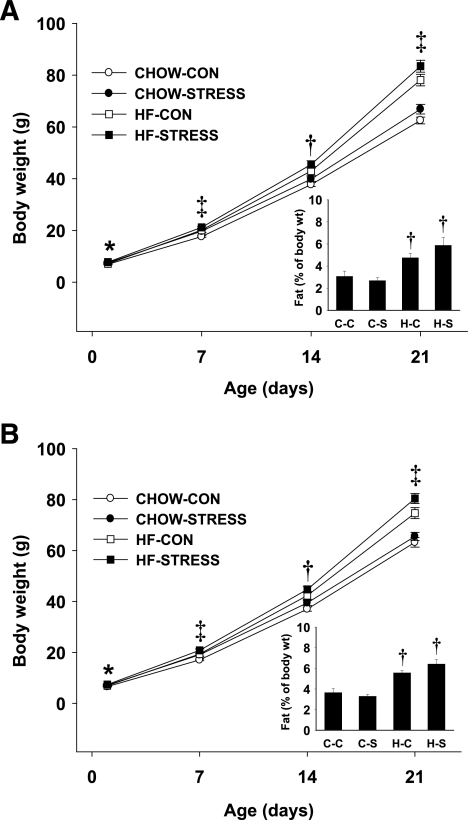
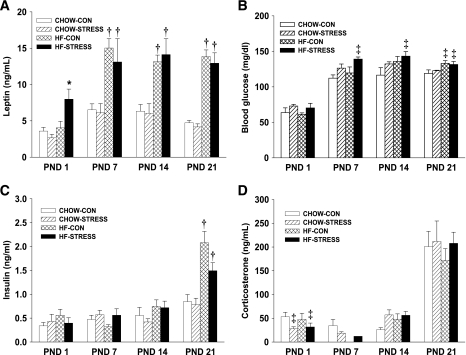
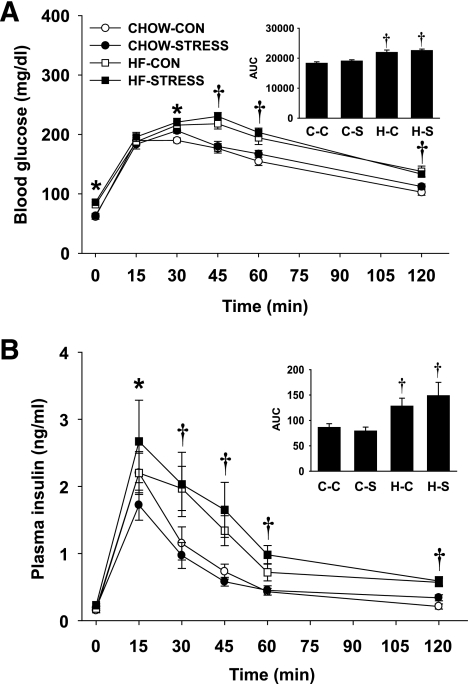
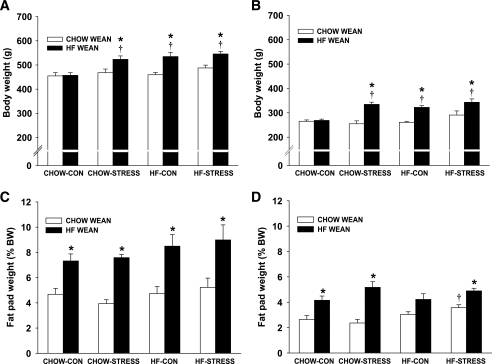
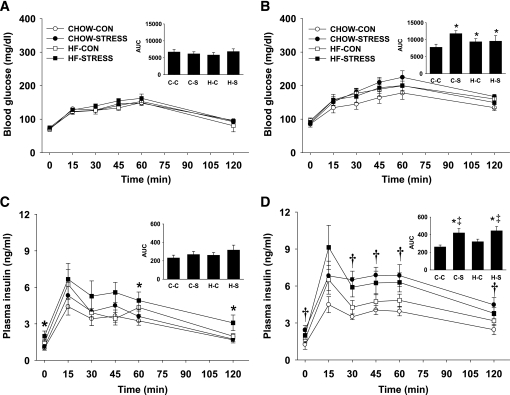
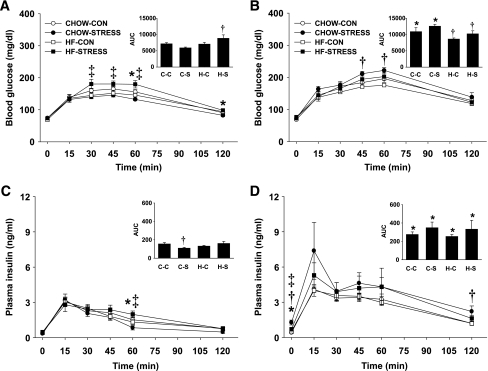
Results: Male and female pups from dams that experienced prenatal stress and/or were on a high-fat diet weighed more beginning on postnatal day 7 compared with standard chow-control pups. Access to high-fat diet at weaning increased the body weight effect through early adulthood and was attributable to greater adiposity. Pups weaned onto standard chow diet showed no significant difference in glucose clearance or insulin secretion. However, pups weaned onto high-fat diet had impaired glucose tolerance if their dams were on a high-fat diet, experienced prenatal stress, or both.

Conclusions: Our data demonstrate that prenatal stress and/or high-fat diet during the intrauterine or postnatal environment affects offspring in a manner that increases their susceptibility to diet-induced obesity and leads to secondary adverse metabolic consequences.


Figures

FIG. 1.
FIG. 1.
A and B: Body weight and fat as a percentage of body weight (inset graphs) of offspring through postnatal day 21. A: Male offspring in each litter were weighed on postnatal days 1, 7, 14, and 21. B: Female offspring in each litter were weighed on postnatal days 1, 7, 14, and 21. Fat as a percentage of body weight was determined on postnatal day 21 (inset graphs). Groups shown are: standard chow–control (CHOW-CON; n = 11 litters), standard chow–stress (CHOW-STRESS; n = 10 litters), high-fat–control (HF-CON; n = 11 litters), and high-fat–stress (HF-STRESS; n = 10 litters). *Main effect of stress, P < 0.05 vs. control group; †main effect of high-fat diet, P < 0.05 vs. standard chow; ‡main effect of high-fat diet and stress, P < 0.05. C-C, standard chow–control; C-S, standard chow–stress group; H-C, high-fat–control group; H-S, high-fat–stress group.
FIG. 2.
FIG. 2.
A–D: Endocrine parameters in male offspring postnatal days (PND) 1–21. A: Plasma leptin. B: Blood glucose. C: Plasma insulin. D: Plasma corticosterone. Groups shown are: standard chow–control (CHOW-CON; n = 11), standard chow–stress (CHOW-STRESS; n = 10), high-fat–control (HF-CON; n = 11), and high-fat–stress (HF-STRESS; n = 10). *P < 0.05 vs. standard chow–control, standard chow–stress, and high-fat–control groups; †P < 0.05 vs. standard chow–control and standard chow–stress groups; ‡P < 0.05 vs. standard chow–control group.
FIG. 3.
FIG. 3.
A and B: Glucose tolerance test (2.0 g/kg, oral gavage) for male and female pups on postnatal day 23. A: Blood glucose after oral administration of glucose. B: Plasma insulin after oral administration of glucose. The integrated AUC was determined for glucose and insulin using the trapezoidal method. Groups shown are: standard chow–control (CHOW-CON; n = 8), standard chow–stress (CHOW-STRESS; n = 8), high-fat–control (HF-CON; n = 8), and high-fat–stress (HF-STRESS; n = 8). *P < 0.05 standard chow–stress, high-fat–control, and high-fat–stress vs. standard chow–control groups; †P < 0.05 high-fat–control and high-fat–stress vs. standard chow–control and standard chow–stress groups. C-C, standard chow–control; C-S, standard chow–stress; H-C, high-fat–control; H-S, high-fat–stress.
FIG. 4.
FIG. 4.
A–D: Body weight and fat as a percentage of body weight for adult male (A) and female (B) offspring. Fat as a percentage of body weight for males (C) and females (D) is expressed as the weight of dorsosubcutaneous, inguinal, and retroperitoneal fat pads as a percentage of body weight. Males weaned on standard chow (CHOW WEAN) are: standard chow–control (CHOW-CON; n = 6), standard chow–stress (CHOW-STRESS; n = 4), high-fat–control (HF-CON; n = 4), and high-fat–stress (HF-STRESS; n = 4). Males weaned on high-fat diet (HF WEAN) are: standard chow–control (n = 4), standard chow–stress (n = 4), high-fat–control (n = 5), and high-fat–stress (n = 4). Females weaned on standard chow are: standard chow–control (n = 5), standard chow–stress (n = 4), high-fat–control (n = 4), and high-fat–stress (n = 4). Females weaned on high-fat diet are: standard chow–control (n = 4), standard chow–stress (n = 4), high-fat–control (n = 5), and high-fat–stress (n = 4). *P < 0.05 vs. weaned on standard chow; †P < 0.05 vs. standard chow–control group.
FIG. 5.
FIG. 5.
A–D: Glucose tolerance test in males on postnatal day 70. Blood glucose (A and B) and plasma insulin (C and D) were determined for 2 h after oral administration of glucose for male offspring weaned onto standard chow (A and C) or high-fat diet (B and D). Males weaned on standard chow are: standard chow–control (CHOW-CON; n = 6), standard chow–stress (CHOW-STRESS; n = 4), high-fat–control (HF-CON; n = 4), and high-fat–stress (HF-STRESS; n = 4). Males weaned on high-fat are: standard chow–control (n = 4), standard chow–stress (n = 4), high-fat–control (n = 5), and high-fat–stress (n = 4). *High-fat diet main effect, P < 0.05; †stress main effect, P < 0.05; ‡high-fat diet and stress interaction, P < 0.05. A–D Insets: The integrated AUC was determined for glucose and insulin using the trapezoidal method. *P < 0.05 vs. corresponding standard chow–weaned group; †P < 0.05 vs. standard chow–control and standard chow–stress groups; ‡P < 0.05 vs. standard chow–control and high-fat–control groups. C-C, standard chow–control; C-S, standard chow–stress; H-C, high-fat–control; H-S, high-fat–stress.
FIG. 6.
FIG. 6.
A–D: Glucose tolerance test in females on postnatal day 70. Blood glucose (A and B) and plasma insulin (C and D) were determined for 2 h after oral administration of glucose for female offspring weaned onto standard chow (A and C) or high-fat diet (B and D). Females weaned onto standard chow are: standard chow–control (CHOW-CON; n = 5), standard chow–stress (CHOW-STRESS: n = 4), high-fat–control (HF-CON; n = 4), and high-fat–stress (HF-STRESS; n = 4). Females weaned onto high-fat are: standard chow–control (n = 4), standard chow–stress (n = 4), high-fat–control (n = 5), and high-fat–stress (n = 4). *High-fat diet main effect, P < 0.05; †stress main effect, P < 0.05. A–D Insets: The integrated AUC was determined for glucose and insulin using the trapezoidal method. *P < 0.05 vs. corresponding standard chow WEAN group; †P < 0.05 vs. standard chow–control and standard chow–stress groups; ‡P < 0.05 vs. standard chow–control and high-fat–control groups. C-C, standard chow–control; C-S, standard chow–stress; H-C, high-fat–control; H-S, high-fat–stress.

Similar articles

Cited by

References

    1. Flegal KM, Carroll MD, Ogden CL, Johnson CL: Prevalence and trends in obesity among US adults, 1999–2000. JAMA 2002; 288: 1723– 1727 - PubMed
    1. Procopiou M, Philippe J: The metabolic syndrome and type 2 diabetes: epidemiological figures and country specificities. Cerebrovasc Dis 2005; 20 ( Suppl. 1:) 2– 8 - PubMed
    1. Ogden CL, Carroll MD, Flegal KM: Epidemiologic trends in overweight and obesity. Endocrinol Metab Clin North Am 2003; 32: 741– 760 - PubMed
    1. Tremblay MS, Katzmarzyk PT, Willms JD: Temporal trends in overweight and obesity in Canada, 1981–1996. Int J Obes Relat Metab Disord 2002; 26: 538– 543 - PubMed
    1. Jebb SA, Rennie KL, Cole TJ: Prevalence of overweight and obesity among young people in Great Britain. Public Health Nutr 2004; 7: 461– 465 - PubMed

Publication types