Comparative Study
. 2009 Feb 24;106(8):2677-82.
doi: 10.1073/pnas.0813249106. Epub 2009 Feb 2.

Alignment-free genome comparison with feature frequency profiles (FFP) and optimal resolutions

Affiliations
Comparative Study

Alignment-free genome comparison with feature frequency profiles (FFP) and optimal resolutions

Gregory E Sims et al. Proc Natl Acad Sci U S A. .

Abstract

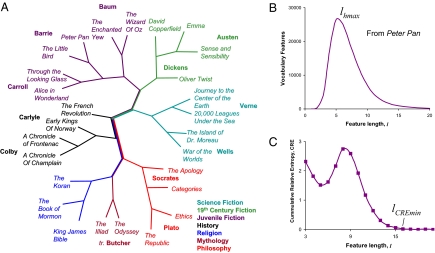
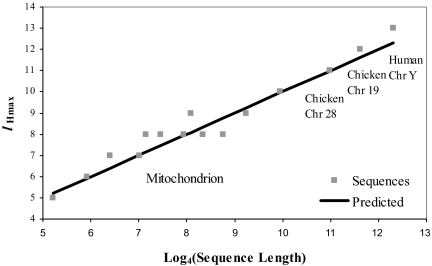
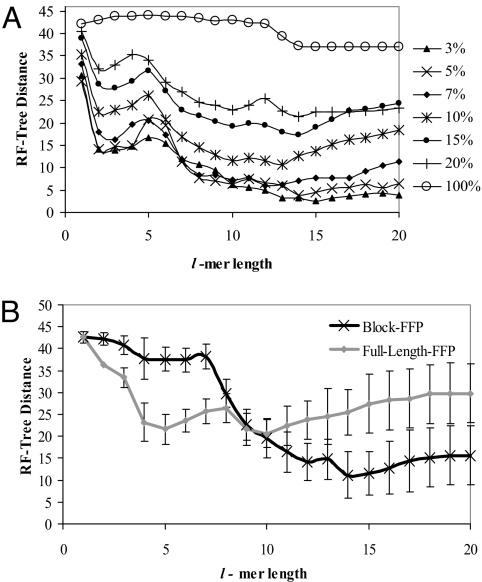
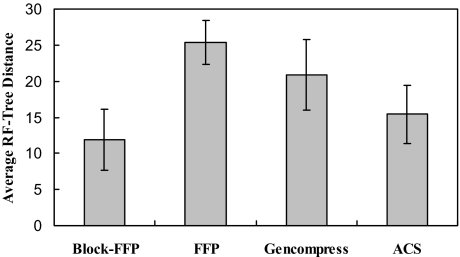
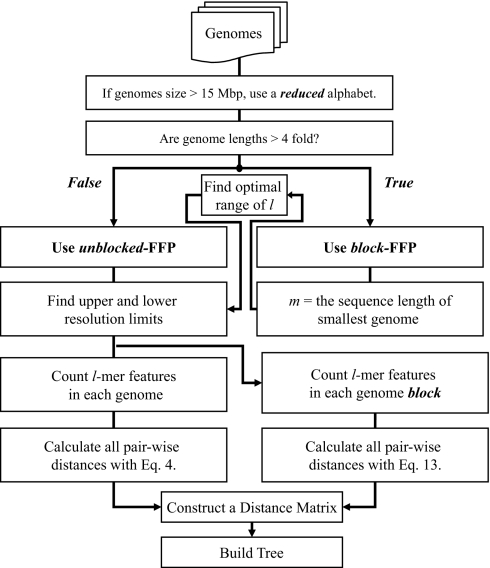
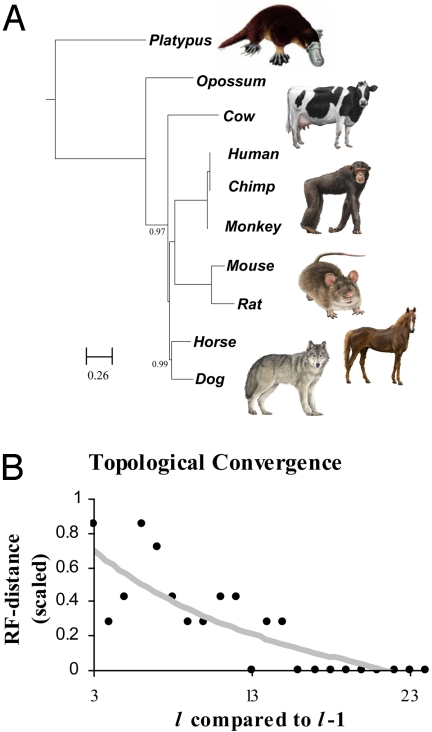
For comparison of whole-genome (genic + nongenic) sequences, multiple sequence alignment of a few selected genes is not appropriate. One approach is to use an alignment-free method in which feature (or l-mer) frequency profiles (FFP) of whole genomes are used for comparison-a variation of a text or book comparison method, using word frequency profiles. In this approach it is critical to identify the optimal resolution range of l-mers for the given set of genomes compared. The optimum FFP method is applicable for comparing whole genomes or large genomic regions even when there are no common genes with high homology. We outline the method in 3 stages: (i) We first show how the optimal resolution range can be determined with English books which have been transformed into long character strings by removing all punctuation and spaces. (ii) Next, we test the robustness of the optimized FFP method at the nucleotide level, using a mutation model with a wide range of base substitutions and rearrangements. (iii) Finally, to illustrate the utility of the method, phylogenies are reconstructed from concatenated mammalian intronic genomes; the FFP derived intronic genome topologies for each l within the optimal range are all very similar. The topology agrees with the established mammalian phylogeny revealing that intron regions contain a similar level of phylogenic signal as do coding regions.


Conflict of interest statement

The authors declare no conflict of interest.

Figures

Fig. 1.
Fig. 1.
Text comparison with FFP. (A) An example of text comparison using the FFP method on English books, each converted into a long character string by removing all punctuation and spaces between words. Books of several different categories/genres are compared. At least 2 books are shown for most authors. High frequency stop features were removed and the feature resolution used is l = 9. (B) Lower limit. Using the children's book Peter Pan as an example, the lower limit of resolution is determined by lHmax. (C) Upper limit. Upper limit is determined by lCREmin.
Fig. 2.
Fig. 2.
Predicted vs. observed lHmax. The peak H values, or lHmax, for a sample of mitochondrial genomes and chromosomes from human and chicken were observed at different lengths, l.
Fig. 3.
Fig. 3.
Validation of the optimal feature length range by simulation. (A) Tree reconstruction, using FFP comparison of a divergent sequence population. Ten populations of 25 sequences each with a known lineage (the reference tree) were generated with the shuffle model. The substitution rate was varied in 7 trials. UPGMA tree reconstructions were compared with the reference tree, using the Robinson–Foulds (RF) measure. The significance of the peak near l = 4–5 is not known. (B) Tree reconstruction of different length sequences, full-length-FFP vs. block-FFP comparison. 10 trees of 25 sequences were generated using the excision model. The error bars indicate the standard deviation of the 10 trees. The block-FFP method outperforms the full-length-FFP comparison for l ≥ 11. The block length, m = 16,000 is the length of the smallest genome.
Fig. 4.
Fig. 4.
Block-FFP vs. other methods: large genome length differences. The methods used are: Block-FFP, blocked comparison, using Eq. 11, and m = 16,000, l = 14; FFP, full-length-FFP comparisons, using Eq. 3 and l = 14; gencompress, normalized complexity distance; ACS, average common substring. Error is the standard deviation.
Fig. 5.
Fig. 5.
Flow chart of the optimal FFP method.
Fig. 6.
Fig. 6.
FFP comparison of intronic genomes. (A) Concatenated intronic regions of mammals were compared using FFP and RY coding. The tree was constructed with neighbor joining, low complexity, high frequency filtering and l = 18. Nodes indicated have <1.0 jackknife support. Scale indicates Jensen–Shannon divergence length. (B) Topological convergence. A neighbor joining tree was constructed from words of length l = 1–24. The topology of each tree reconstructed from words of length l is compared with trees from l-1. All trees converge to the same topology above l = 16.

References

    1. Wildman DE, et al. Genomics, biogeography, and the diversification of placental mammals. Proc Natl Acad Sci USA. 2007;104:14395–14400. - PMC - PubMed
    1. Huynen MA, Bork P. Measuring genome evolution. Proc Natl Acad Sci USA. 1998;95:5849–5856. - PMC - PubMed
    1. Venter JC, et al. The sequence of the human genome. Science. 2001;291:1305–1350.
    1. Berney E, et al. Identification and analysis of functional elements in 1% of the human genome by the ENCODE pilot project. Nature. 2007;447:799–816. - PMC - PubMed
    1. Deerwester S, et al. Indexing by latent semantic analysis. J Am Soc Inform Sci. 1988;41:391–407.

Publication types

LinkOut - more resources