

doi: 10.1534/genetics.108.100065.
Epub 2009 Feb 2.
De Novo identification of single nucleotide mutations in Caenorhabditis elegans using array comparative genomic hybridization
Affiliations
- PMID: 19189945
- PMCID: PMC2666529
- DOI: 10.1534/genetics.108.100065
Item in Clipboard
De Novo identification of single nucleotide mutations in Caenorhabditis elegans using array comparative genomic hybridization
Genetics.
2009 Apr.
Abstract
Array comparative genomic hybridization (aCGH) has been used primarily to detect copy-number variants between two genomes. Here we report using aCGH to detect single nucleotide mutations on oligonucleotide microarrays with overlapping 50-mer probes. This technique represents a powerful method for rapidly detecting novel homozygous single nucleotide mutations in any organism with a sequenced reference genome.
Figures
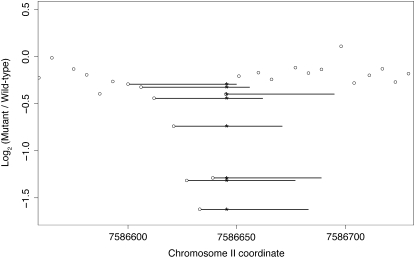
Novel detection of an A → T transversion in syd-1. Normalized log2 ratios of fluorescence intensities (mutant/wild type) are plotted as open circles at the first base of each 50-mer probe. The length of each probe targeted by the SNP is illustrated by a horizontal bar, and the position of the SNP is indicated by an asterisk. Multiple adjacent overlapping probes targeted the point mutation, so its effect on hybridization was assayed several times. Aberrant fluorescence ratios at probes targeting the SNP stand out from nearby probes targeting the wild-type sequence. Nematodes were grown on NGM agar plates spread with a lawn of Escherichia coli strain OP50 or χ1666. A mixed-stage population of VC1415 {unc-4(e120)/mIn1[mIs14 dpy-10(e128)] II} was subjected to mutagenesis with TMP at 10 μg/ml for 1 hr followed by UV irradiation for 90 sec at 340 μW/cm2 and then placed on food at 20°. Both unc-4 and dpy-10 mutations are recessive, and the mIn1 inversion suppresses recombination along the middle of chromosome II from lin-31 to rol-1 (Edgley and Riddle 2001); the mIs14 element confers a semidominant GFP signal confined to the pharyngeal muscle. After 48 hr, 30 gravid wild-type GFP+ P0 adults were singly picked onto 60-mm petri plates and allowed to self. Seven wild-type GFP+ F1 progeny were singly picked from each parent for a total of 210 clones, from which 100 were selected that segregated viable fertile Unc-4 F2 progeny. Single gravid Unc-4 progeny were picked from each of these plates and used to establish 100 new populations homozygous for unc-4 and any newly induced mutations within the genetic interval balanced by mIn1. Nematode populations were grown to starvation on three 60-mm petri plates, harvested by washing, centrifugation, and aspiration of the supernatant, and frozen at −80° in 2.5 vol of worm lysis buffer [50 mm KCl; 10 mm Tris–HCl, pH 8.3; 2.5 mm MgCl2; 0.45% NP-40 (Igepal); 0.45% Tween-20; 0.01% gelatin; 300 μg/ml Proteinase K]. Crude lysates were prepared from frozen samples by incubation at 65° for 2 hr. Genomic DNA was prepared from the lysates as described previously by Maydan et al. (2007). The filters used to select the 50-mer oligonucleotides for the exon-centric chromosome II chip have been described by Maydan et al. (2007). DNA sample handling, labeling with Cy3 (mutants and CB4856) or Cy5 [wild-type N2 (VC196) reference], hybridization, and imaging were performed by NimbleGen (Selzer et al. 2005). Extraction of fluorescence intensities and data normalization were performed as previously described (Maydan et al. 2007). Many experiments were performed using the same chromosome II array design, which allowed an approximate determination (by simply averaging) and subsequent subtraction of local bias in the log2 ratio signal for individual experiments. The signature of a SNP in the log2 ratio signal is similar to that of a deletion in CGH except that the log2 ratio shows only a modest reduction for the affected probes, and of course only a few probes are affected.
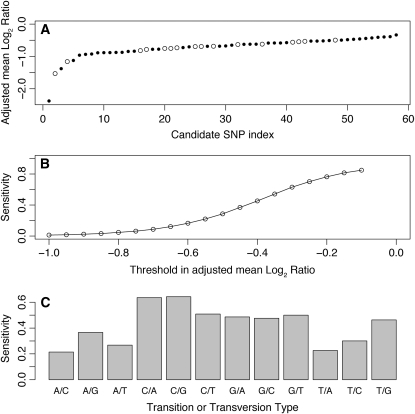
Estimation of the sensitivity and specificity of the current SNP detection technique. The SNP score, or adjusted mean log2 ratio, corresponds to the average log2 ratio of the probes where the mutation is located in a window 13 bases wide near the 5′-end of the oligonucleotide, which is away from the slide and therefore freely floating in the solution, and is renormalized by subtracting the mean of the log2 ratio in the immediate left and right 50-base-wide flanking regions for oligonucleotides not overlapping the mutation. (A) The SNP score is shown for the candidate SNPs that we have sequenced with the candidates ordered according to their score. The open and solid circles represent the candidates confirmed and not confirmed by sequencing, respectively. For example, a score < −0.45 would include all 16 confirmed cases and 36 nonconfirmed candidates, corresponding to a specificity of 31%. Microarrays were designed by tiling the target regions with equally spaced overlapping 50-mer oligonucleotides without any filtering except for the elimination of the repeats listed in WormBase. The earlier arrays were designed using the WormBase data freeze version WS170 while the most recent designs used version WS180. A single 380,000-oligonucleotide array was designed for each region of interest except for one experiment in which two arrays have been used to cover a genomic region 4.9 Mb wide. Mutation candidates were selected by analyzing the CGH data by visual inspection and use of a segmentation algorithm (Maydan et al. 2007) or a sliding-window technique. PCR was used to amplify products of a few hundred base pairs surrounding the candidate regions. DNA sequencing of these products precisely identified each mutation. (B) The detection sensitivity for the SNPs in the CB4856 (Hawaiian) experiments is shown as a function of the threshold in the SNP score. Using a threshold of −0.45 as before would correspond to a sensitivity of 37%. (C) The sensitivity is shown separately for each transition and transversion type when using the same threshold of −0.45. The natural isolate CB4856 and all mutant strains were prepared from isogenic cultures of worms. Nematode populations were grown to starvation on three 60-mm petri plates. DNA preparation, CGH, and other array data analyses were performed as described in Figure 1. From all the CB4856 SNPs present in WormBase data freeze WS170, we selected 2639 that were far enough from all the known mutations in that strain to minimize the presence of mutations in the immediate flanking regions of the selected SNPs. Once again the only filter used in the design process was to eliminate the known repeats. Each SNP was represented on the array by a maximum of 150 50-mer oligonucleotides spaced 1 bp apart, ≤50 oligonucleotides affected by the mutation, and ≤50 oligonucleotides for each immediate left and right flanking region. For each SNP, the set of probes alternated between the sequence from the plus and minus strand templates; thus, for a given strand, the minimum spacing between probes was equal to 2 bases. For this experiment, we performed dye-flip hybridizations to evaluate the Cy3/Cy5 bias. In that experiment, each SNP log2 ratio profile was measured four times, with two separate hybridizations and on both strands each time. When calculating the SNP detection sensitivity, each of the four profiles was considered as a separate measurement since each profile is associated with an oligonucleotide spacing of 2 bp, which is more representative of the SNP detection experiments that we used to evaluate the specificity of the technique. We could have averaged those four profiles to reduce the standard deviation before calculating the sensitivity, but this would not have allowed a direct and meaningful comparison with the data from our SNP detection experiments.
References
Publication types
MeSH terms
LinkOut - more resources
Full Text Sources
Miscellaneous
