. 2009 Apr 3;284(14):9074-82.
doi: 10.1074/jbc.M806233200. Epub 2009 Feb 3.

GLI1 is a direct transcriptional target of EWS-FLI1 oncoprotein

Affiliations

GLI1 is a direct transcriptional target of EWS-FLI1 oncoprotein

Elspeth Beauchamp et al. J Biol Chem. .

Abstract

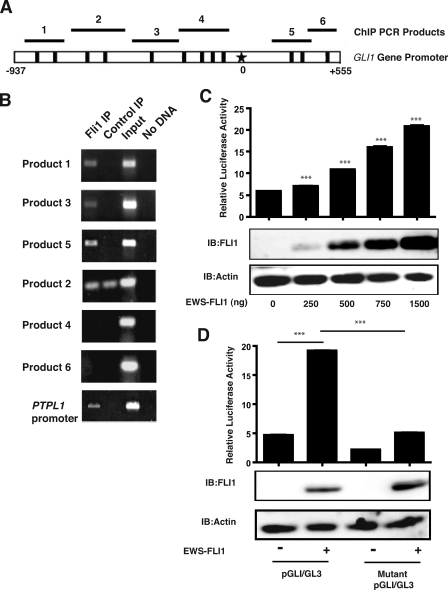
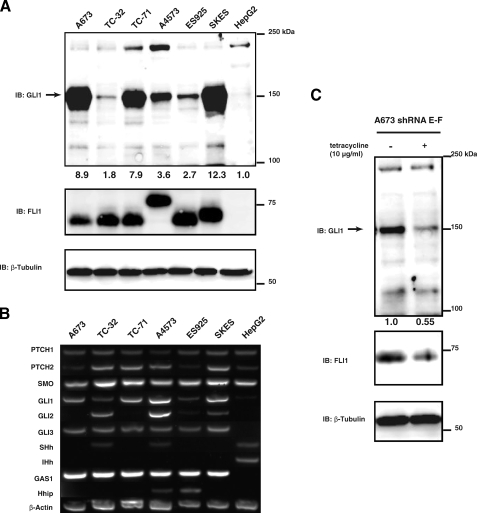
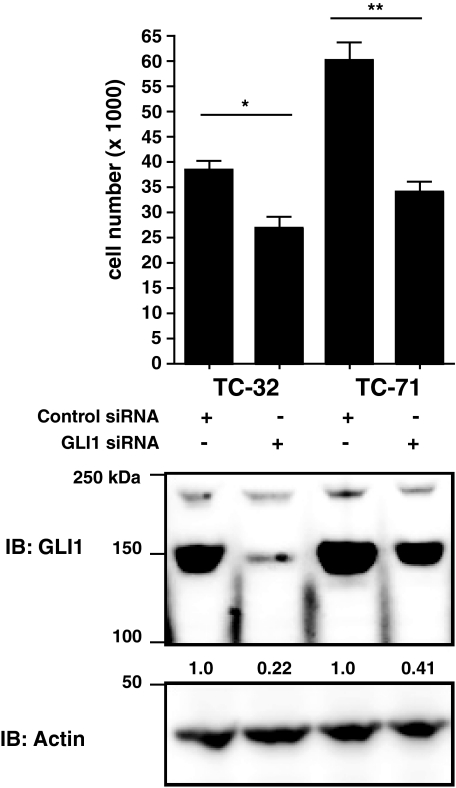
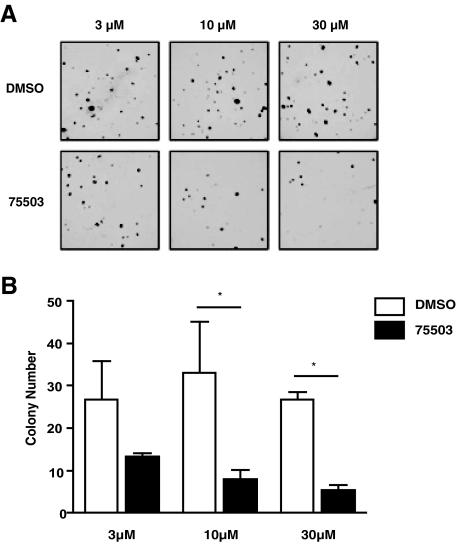
Ewing sarcoma family of tumors (ESFT) is an undifferentiated neoplasm of the bone and soft tissue. ESFT is characterized by a specific chromosomal translocation occurring between chromosome 22 and (in most cases) chromosome 11, which generates an aberrant transcription factor, EWS-FLI1. The function of EWS-FLI1 is essential for the maintenance of ESFT cell survival and tumorigenesis. The Hedgehog pathway is activated in several cancers. Oncogenic potential of the Hedgehog pathway is mediated by increasing the activity of the GLI family of transcription factors. Recent evidence suggests that EWS-FLI1 increases expression of GLI1 by an unknown mechanism. Our data from chromatin immunoprecipitation and promoter reporter studies indicated GLI1 as a direct transcriptional target of EWS-FLI1. Expression of EWS-FLI1 in non-ESFT cells increased GLI1 expression and GLI-dependent transcription. We also detected high levels of GLI1 protein in ESFT cell lines. Pharmacological inhibition of GLI1 protein function decreased proliferation and soft agar colony formation of ESFT cells. Our results establish GLI1 as a direct transcriptional target of EWS-FLI1 and suggest a potential role for GLI1 in ESFT tumorigenesis.


Figures

FIGURE 1.
FIGURE 1.
EWS-FLI1 binds to and activates the GLI1 promoter. A, a map of the full-length GLI1 promoter is shown. The black boxes represent the 12 GGAA sites, which are possible EWS-FLI1-binding sites. The star represents the transcription start site. The black bars with numbers show the approximate positions of the PCR products shown in ChIP experiments. B, chromatin immunoprecipitation was performed by cross-linking the DNA of TC-71 cells followed by enrichment of DNA-protein complexes with anti-FLI1 antibody. Six different primer pairs were designed to cover all 12 possible GGAA binding sites on both strands in the GLI1 promoter and then used to amplify DNA by PCR. The PTPL1 primers served as a positive control for positive EWS-FLI1 binding. Control IP was no antibody. Input represents the cross-linked DNA prior to immunoprecipitation. C, COS7 cells were cotransfected with 0, 250, 500, 750, 1000, and 1500 ng of EWS-FLI1 and the GLI1 promoter luciferase construct (GLI1/pGL3). Bars represent the means of the relative luciferase activity, which is the calculated by dividing the luciferase activity by the Renilla activity used as a transfection control. The error bars are the standard deviations. (***, p < 0.001, using a two-tailed Student's t test). Transfection assays were performed in triplicate. D, COS7 cells were cotransfected with and without EWS-FLI1 and the wild type GLI1 promoter luciferase construct or a mutant GLI1 promoter construct that has the FLI1 DNA-binding sites mutated. The bars represent the means of the relative luciferase activity, which is calculated by dividing the luciferase activity by the Renilla activity used as a transfection control. The error bars are the standard deviations (***, p < 0.001 using a two-tailed Student's t test). Transfection assays were performed in triplicate and were repeated twice. IB, immunoblotting.
FIGURE 2.
FIGURE 2.
EWS-FLI1 expression in COS7 cells leads to an increase in endogenous GLI1 protein expression and transcriptional activity. A, COS7 cells were transfected with EWS-FLI1 or an empty vector control. Whole cell lysates were subjected to SDS-PAGE and subsequent immunoblotting with GLI1, FLI1, or actin antibody. FLI1 immunoblotting confirmed the expression of EWS-FLI1 and actin was used as a loading control. The values below the top panel are the densitometry values and are given as fold increase over the empty vector control. B, COS7 cells were cotransfected with and without EWS-FLI1 and a pGL38xGli responsive luciferase construct. Twenty-four hours after transfection, the cells were treated with the cyclopamine or 75503 GLI inhibitor at a concentration of 30 μm in 1% DMSO for 24 h. The columns represent the means of the relative luciferase activity, which is calculated by dividing the luciferase activity by the Renilla activity used as a transfection control. The error bars are the standard deviations (*, p < 0.05; ***, p < 0.001 using a two-tailed Student's t test). Transfection assays were performed in triplicate and repeated three times. One representative experiment is shown in this figure. IB, immunoblotting.
FIGURE 3.
FIGURE 3.
GLI1 is expressed in ESFT cell lines, and knockdown of EWS-FLI1 decreases GLI1 expression in ESFT cell line A673. A, whole cell lysates from six different ESFT cell lines and HepG2 were subjected to SDS-PAGE. GLI1 expression was determined by immunoblotting with a GLI1 antibody. The arrow indicates the GLI1 band at 150 kDa. All of the ESFT cell lines express EWS-FLI1 as shown by immunoblotting with a Fli1 antibody. The size difference is due to the type of gene fusion that occurs. β-Tubulin was used a loading control. The numbers under the top panel are densitometry values. They are given as fold increase over the HepG2 cell line after normalizing each band to its corresponding loading control band value. B, total RNA from ESFT and HepG2 cell lines was isolated and analyzed by RT-PCR for Hedgehog pathway components. All of the ESFT cells lines express GLI1 as well as the GLI target GAS1. HepG2 does not express any GLI genes or GAS1. Of the ESFT cells only TC-32 and A4573 expresses Hh ligand. β-Actin was used as a positive control. Desert Hedgehog was also examined and was negative for all cell lines (data not shown). C, A673 cells stably transfected with a tetracycline inducible shRNA for EWS-FLI1 were plated and treated with 0 or 10 μg/ml of tetracycline for 96 h. After 96 h the cells were lysed, and whole cell lysates were subjected to SDS-PAGE and subsequent immunoblotting with GLI1, FLI1, or β-tubulin antibody. FLI1 immunoblotting confirmed the knockdown of EWS-FLI1 in tetracycline treated cells and actin was used as a loading control. IB, immunoblotting.
FIGURE 4.
FIGURE 4.
Knockdown of GLI1 by siRNA decreases proliferation of ESFT cells. TC-32 and TC-71 cells were electroporated with control scrambled or GLI1 siRNA. TC-32, were plated in triplicate at a density of 1,000 cells/well in a 96-well plate. TC-71 cells were plated at a density of 5,000 cells/well in a 96-well plate. After 3 (TC-71) or 5 (TC-32) days cell proliferation was measured by a WST assay. Proliferation is shown as the number of viable cells/well. The experiment was done in triplicate and repeated four times. Shown is a representative experiment. The error bars are the standard deviations (**, p < 0.01; ***, p < 0.001 using a two-tailed Student's t test). Whole cell lysates from TC-32 and TC-71 cells treated with control or GLl1 siRNA reagents were subjected to SDS-PAGE. GLI1 expression was determined by immunoblotting with a GLI1 antibody. Actin was used a loading control. The numbers under the top panel are densitometry values. They are given as fold increase over the control cell line after normalizing each band to its corresponding loading control band value. IB, immunoblotting.
FIGURE 5.
FIGURE 5.
Treatment of ESFT cells with a small molecule inhibitor of GLI1 decreases proliferation. A, TC-32, TC-71, and HepG2 cells were plated in triplicate at a density of 1,000 cells/well in a 96-well plate. The cells were treated with 75503 at 10 and 30 μm in 1% DMSO. After 72 h cell proliferation was measured by a WST assay. Proliferation is shown as the percentage of growth over 1% DMSO-treated cells. The experiment was done in triplicate and repeated three times. The error bars are the standard deviations (**, p < 0.01; ***, p < 0.001 using a two-tailed Student's t test). B, TC-32 and TC-71 cells were plated in triplicate at a density of 1,000 cells/well in a 96-well plate. The cells were treated with cyclopamine and 75503 at 10 and 30 μm in 1% DMSO. After 72 h cell proliferation was measured by a WST assay. Proliferation is shown as the percentage of growth over 1% DMSO-treated cells. The experiment was done in triplicate and repeated three times. The error bars are the standard deviations (*, p < 0.05; **, p < 0.01; ***, p < 0.001 using a two-tailed Student's t test). Shown is a representative experiment. C, TC-32, TC-71, and DAOY cells were plated in triplicate at a density of 1,000 cells/well in a 96-well plate. The cells were treated with cyclopamine at 10 and 30 μm in 1% DMSO. After 72 h cell proliferation was measured by a WST assay. Proliferation is shown as the percentage of growth over 1% DMSO-treated cells. The experiment was done in triplicate. The error bars are the standard deviations (*, p < 0.05; **, p < 0.01; ***, p < 0.001 using a two-tailed Student's t test). D, TC-32 cells were transfected with the pGL38XGLI luciferase reporter construct and Renilla-TK construct. Forty-eight hours later, the cells were treated for 24 h with cyclopamine and 75503 at 10 and 30 μm. The bars represent the means of the relative luciferase activity, which is calculated by dividing the luciferase activity by the Renilla activity used as a transfection control. The error bars are the standard deviations (***, p < 0.001 using a two-tailed Student's t test). Transfection assays were performed in triplicate and were repeated twice. Shown is a representative experiment.
FIGURE 6.
FIGURE 6.
Treatment of ESFT cells with a small molecule inhibitor of GLI1 decreases soft agar colony formation. A, TC-32 cells were plated in soft agar in triplicate at a density of 5,000 cells/well in a 12-well tissue culture plate. The cells were treated with DMSO or 75503 at 3, 10, and 30 μm, which was added on top every 2 days in 50 μl of volume. B, graph shown is the quantification of A. The error bars are the standard deviations (*, p < 0.05 using a one-way analysis of variance, Bonferroni's multiple comparison test).

References

    1. Grier, H. E., Krailo, M. D., Tarbell, N. J., Link, M. P., Fryer, C. J., Pritchard, D. J., Gebhardt, M. C., Dickman, P. S., Perlman, E. J., Meyers, P. A., Donaldson, S. S., Moore, S., Rausen, A. R., Vietti, T. J., and Miser, J. S. (2003) N. Engl. J. Med. 348 694–701 - PubMed
    1. Sandberg, A. A., and Bridge, J. A. (2000) Cancer Genet Cytogenet. 123 1–26 - PubMed
    1. Tanaka, K., Iwakuma, T., Harimaya, K., Sato, H., and Iwamoto, Y. (1997) J. Clin. Investig. 99 239–247 - PMC - PubMed
    1. Ouchida, M., Ohno, T., Fujimura, Y., Rao, V. N., and Reddy, E. S. (1995) Oncogene 11 1049–1054 - PubMed
    1. Chansky, H. A., Barahmand-Pour, F., Mei, Q., Kahn-Farooqi, W., Zielinska-Kwiatkowska, A., Blackburn, M., Chansky, K., Conrad, E. U., III, Bruckner, J. D., Greenlee, T. K., and Yang, L. (2004) J. Orthop. Res. 22 910–917 - PubMed

Publication types

MeSH terms

LinkOut - more resources