

Using ergosterol to mitigate the deleterious effects of ethanol on bilayer structure
- PMID: 19191714
- PMCID: PMC2668826
- DOI: 10.1021/jp803092z
Using ergosterol to mitigate the deleterious effects of ethanol on bilayer structure
Erratum in
- J Phys Chem B. 2009 Apr 23;113(16):5675. Yim, Wen-Saul [corrected to Yim, Wen-Sau]
Abstract
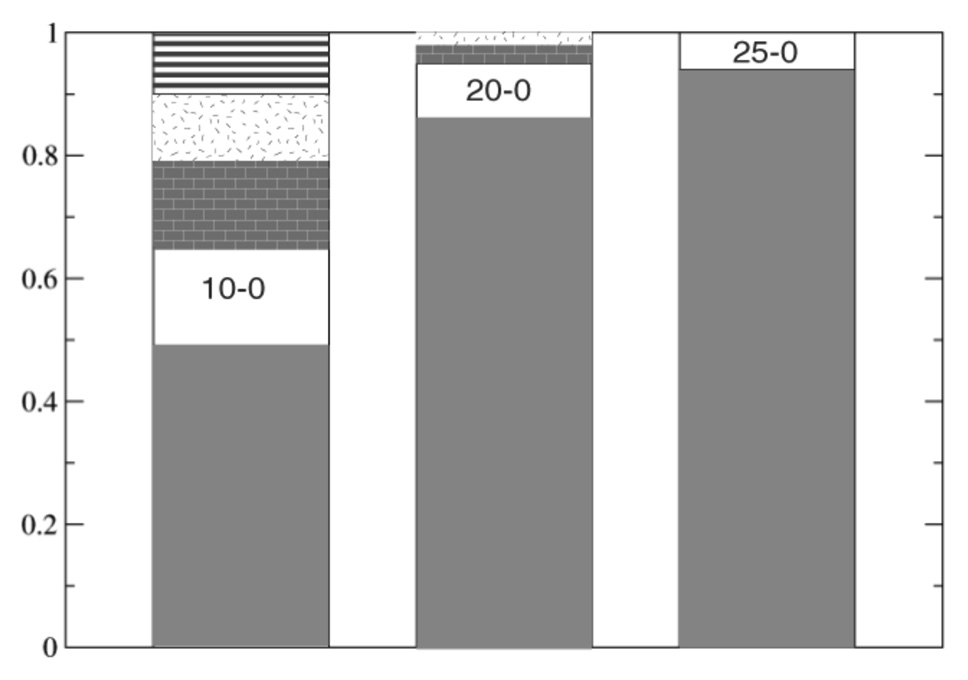
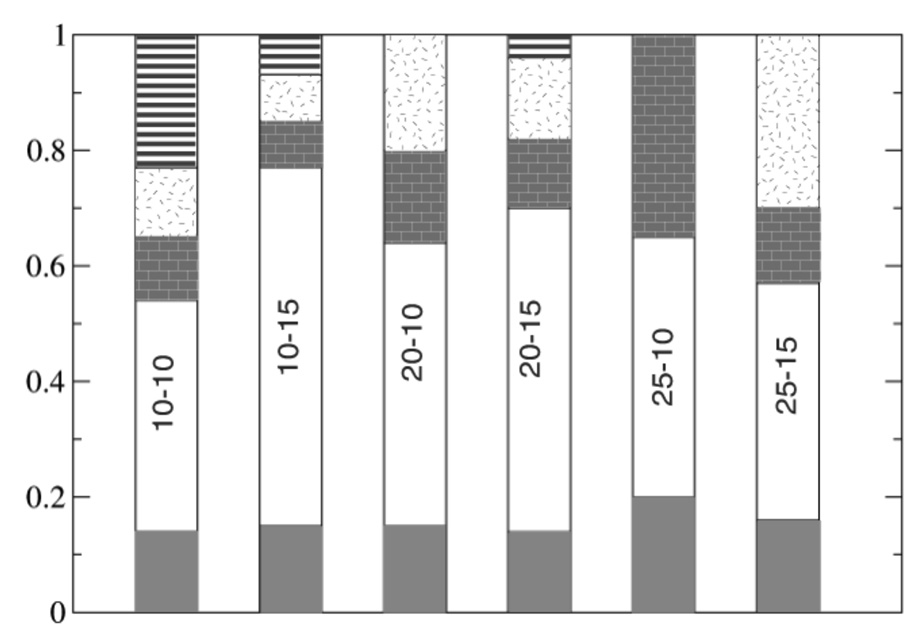
In wine fermentations, yeast is exposed to concentrated ethanol solutions. Ergosterol, a sterol that is found in lower eukaryotic membranes, helps preserve the structural integrity of yeast membranes in stressful environmental conditions. A premature arrest in ethanol production due to unknown metabolic changes in yeasts results in undesirably large concentrations of residual sugar and may be caused by the formation of an ethanol-induced interdigitated phase. We use atomistic molecular dynamics simulations to examine the induction of the interdigitated phase in model yeast membranes that contain either 0, 10, 20, 25 mol % ergosterol in ethanol concentrations of 0, 10, 15 vol %. The 25 mol % ergosterol system shows a similar level of interdigitation for the 0 and 10 vol % ethanol solutions, indicating that ergosterol molecules in this system are able to effectively counteract the disruptive behavior of ethanol molecules. However, at a 15 vol % ethanol solution, the amount of interdigitation triples and this ethanol concentration is similar to the concentrations found in stuck fermentations. The other three ergosterol concentrations studied (0, 10, 20 mol %) show larger quantities of interdigitation in the 10 vol % ethanol solution than the 0 vol % solution. Thus, the 25 mol % ergosterol bilayer, which is representative of the ergosterol concentrations seen in yeast membranes, is unique in the systems examined in its ability to delay the onset of ethanol-induced interdigitation. The concentration of ergosterol affects the permeability of a fluid-phase bilayer, where the 10 mol % ergosterol bilayer is more permeable to ethanol than either a bilayer containing no ergosterol molecules or a bilayer containing 20/25 mol % ergosterol. This lipid permeability appears to be correlated with the existence of a lipid region whose lipids neither have direct contact with ergosterol molecules nor exhibit bulk lipid/lipid interactions.
Figures


Similar articles
-
Elasticity and phase behavior of DPPC membrane modulated by cholesterol, ergosterol, and ethanol.Biophys J. 2005 Oct;89(4):2481-93. doi: 10.1529/biophysj.104.057943. Epub 2005 Jul 29. Biophys J. 2005. PMID: 16055540 Free PMC article.
-
Influence of ethanol on lipid/sterol membranes: phase diagram construction from AFM imaging.Langmuir. 2010 Jul 6;26(13):10415-8. doi: 10.1021/la1012268. Langmuir. 2010. PMID: 20518564
-
Role of unsaturated lipid and ergosterol in ethanol tolerance of model yeast biomembranes.Biophys J. 2012 Feb 8;102(3):507-16. doi: 10.1016/j.bpj.2011.12.038. Epub 2012 Feb 7. Biophys J. 2012. PMID: 22325273 Free PMC article.
-
Comparative molecular dynamics study of lipid membranes containing cholesterol and ergosterol.Biophys J. 2006 Apr 1;90(7):2368-82. doi: 10.1529/biophysj.105.072801. Epub 2006 Jan 6. Biophys J. 2006. PMID: 16399829 Free PMC article.
-
Solute effects on the colloidal and phase behavior of lipid bilayer membranes: ethanol-dipalmitoylphosphatidylcholine mixtures.Biophys J. 1994 Sep;67(3):1067-79. doi: 10.1016/S0006-3495(94)80572-7. Biophys J. 1994. PMID: 7811917 Free PMC article.
Cited by
-
Zygosaccharomyces rouxii Combats Salt Stress by Maintaining Cell Membrane Structure and Functionality.J Microbiol Biotechnol. 2020 Jan 28;30(1):62-70. doi: 10.4014/jmb.1904.04006. J Microbiol Biotechnol. 2020. PMID: 31635442 Free PMC article.
-
Alcohols enhance the rate of acetic acid diffusion in S. cerevisiae: biophysical mechanisms and implications for acetic acid tolerance.Microb Cell. 2017 Dec 1;5(1):42-55. doi: 10.15698/mic2018.01.609. Microb Cell. 2017. PMID: 29354649 Free PMC article.
-
Drunken Membranes: Short-Chain Alcohols Alter Fusion of Liposomes to Planar Lipid Bilayers.Biophys J. 2017 Jan 10;112(1):121-132. doi: 10.1016/j.bpj.2016.11.3205. Biophys J. 2017. PMID: 28076803 Free PMC article.
-
ZmMTOPVIB Enables DNA Double-Strand Break Formation and Bipolar Spindle Assembly during Maize Meiosis.Plant Physiol. 2020 Dec;184(4):1811-1822. doi: 10.1104/pp.20.00933. Epub 2020 Oct 19. Plant Physiol. 2020. PMID: 33077613 Free PMC article.
-
Examining the role of membrane lipid composition in determining the ethanol tolerance of Saccharomyces cerevisiae.Appl Environ Microbiol. 2014 May;80(10):2966-72. doi: 10.1128/AEM.04151-13. Epub 2014 Mar 7. Appl Environ Microbiol. 2014. PMID: 24610851 Free PMC article.
References
-
- Rass-Hansen J, Falsig H, Jorgensen B, Christensen CH. J. Chem. Technol. Biotechnol. 2007;82:329–333.
-
- Sanderson K. Nature. 2006;444:673–676. - PubMed
-
- Block DE, Bisson LF. Ethanol tolerance in Saccharomyces. In: Ciani M, editor. Biodiversity and Biotechnology of Wine Yeasts. Kerala, India: 2002.
-
- Bisson LF. Am. J. Enol. Vitic. 1999;50:107–119.
-
- Bloom M, Mouritsen OG. Can. J. Chem. 1988;66:706–712.
Publication types
MeSH terms
Substances
Grants and funding
LinkOut - more resources
Full Text Sources
Molecular Biology Databases
