

Genetic modulation of striatal volume by loci on Chrs 6 and 17 in BXD recombinant inbred mice
- PMID: 19191878
- PMCID: PMC2706028
- DOI: 10.1111/j.1601-183X.2009.00473.x
Genetic modulation of striatal volume by loci on Chrs 6 and 17 in BXD recombinant inbred mice
Abstract
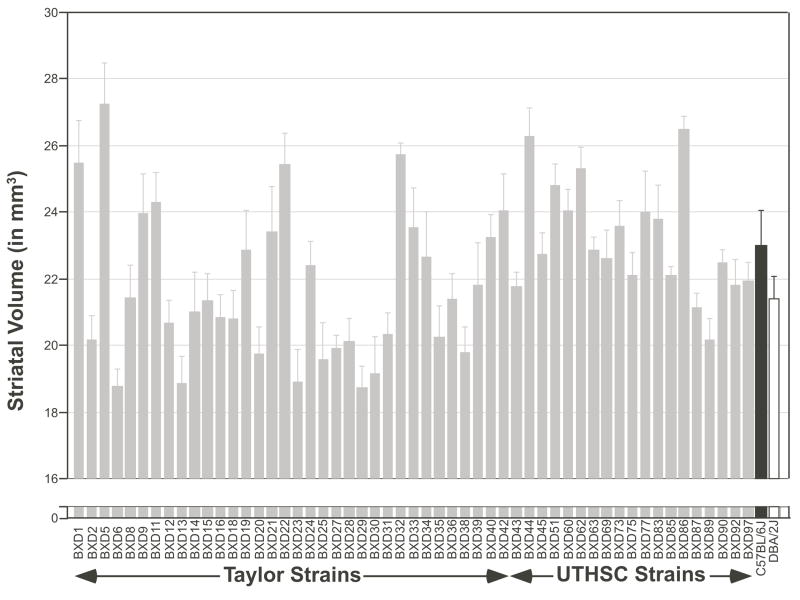
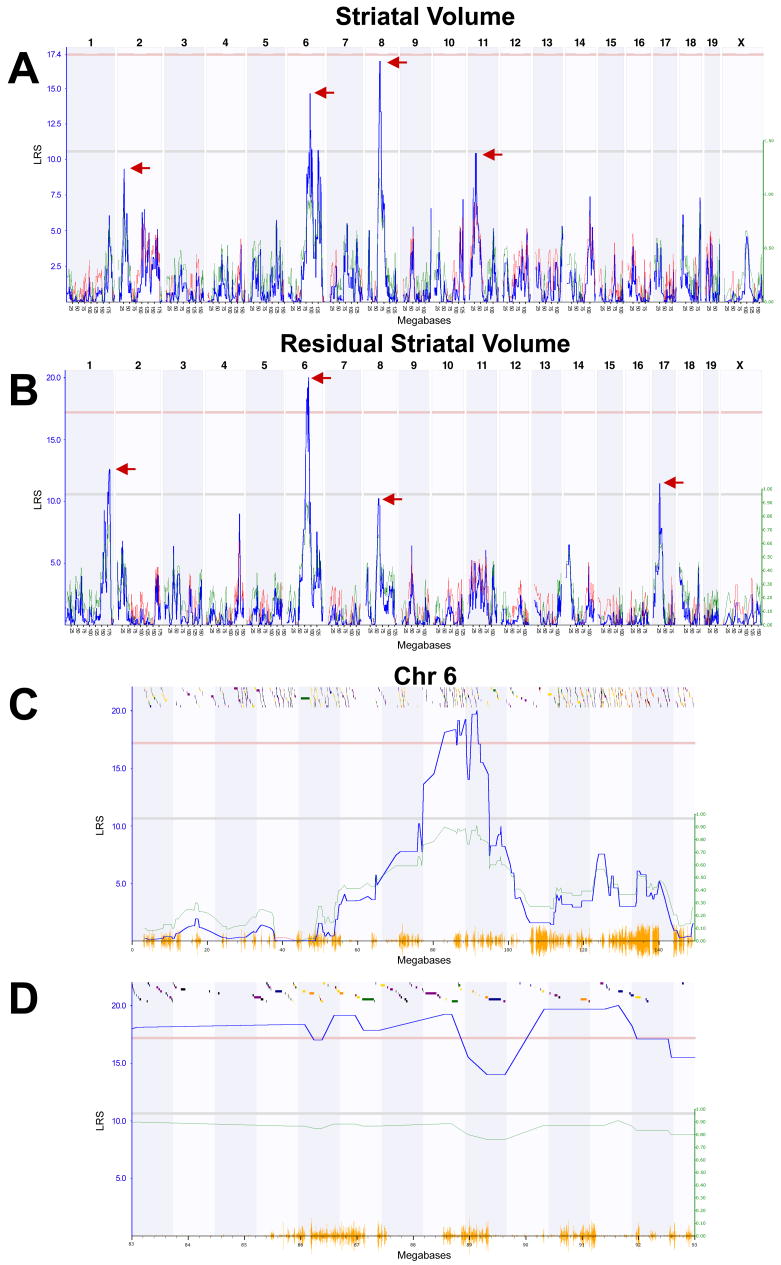
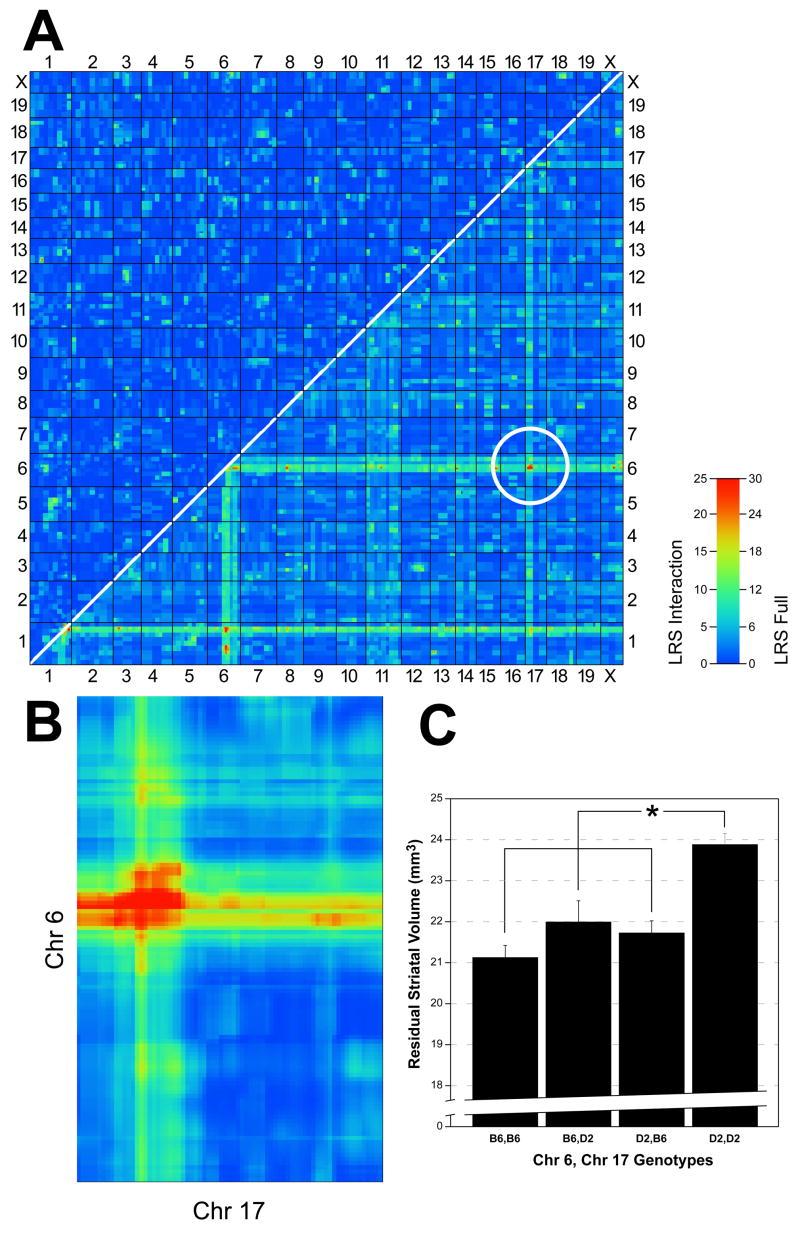
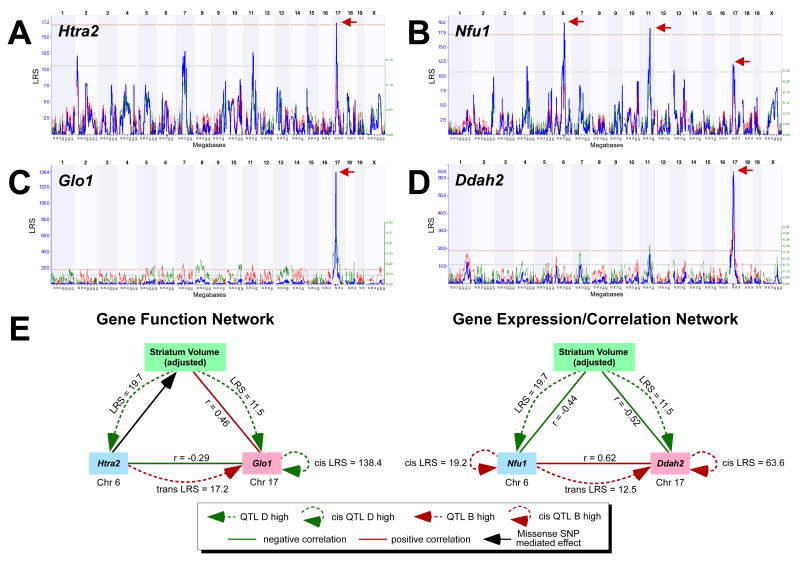
Natural variation in the absolute and relative size of different parts of the human brain is substantial, with a range that often exceeds a factor of 2. Much of this variation is generated by the cumulative effects of sets of unknown gene variants that modulate the proliferation, growth and death of neurons and glial cells. Discovering and testing the functions of these genes should contribute significantly to our understanding of differences in brain development, behavior and disease susceptibility. We have exploited a large population of genetically well-characterized strains of mice (BXD recombinant inbred strains) to map gene variants that influence the volume of the dorsal striatum (caudate-putamen without nucleus accumbens). We used unbiased methods to estimate volumes bilaterally in a sex-balanced sample taken from the Mouse Brain Library (www.mbl.org). We generated a matched microarray data set to efficiently evaluate candidate genes (www.genenetwork.org). As in humans, volume of the striatum is highly heritable, with greater than twofold differences among strains. We mapped a locus that modulates striatal volume on chromosome (Chr) 6 at 88 +/- 5 Mb. We also uncovered an epistatic interaction between loci on Chr 6 and Chr 17 that modulates striatal volume. Using bioinformatic tools and the corresponding expression database, we have identified positional candidates in these quantitative trait locus intervals.
Figures
Similar articles
-
The genetic control of neocortex volume and covariation with neocortical gene expression in mice.BMC Neurosci. 2009 May 9;10:44. doi: 10.1186/1471-2202-10-44. BMC Neurosci. 2009. PMID: 19426526 Free PMC article.
-
Complex trait analysis of the mouse striatum: independent QTLs modulate volume and neuron number.BMC Neurosci. 2001;2:5. doi: 10.1186/1471-2202-2-5. Epub 2001 Apr 17. BMC Neurosci. 2001. PMID: 11319941 Free PMC article.
-
Genetic architecture of the mouse hippocampus: identification of gene loci with selective regional effects.Genes Brain Behav. 2003 Aug;2(4):238-52. doi: 10.1034/j.1601-183x.2003.00030.x. Genes Brain Behav. 2003. PMID: 12953790
-
Using gene expression databases for classical trait QTL candidate gene discovery in the BXD recombinant inbred genetic reference population: mouse forebrain weight.BMC Genomics. 2008 Sep 25;9:444. doi: 10.1186/1471-2164-9-444. BMC Genomics. 2008. PMID: 18817551 Free PMC article.
-
eQTL analysis in mice and rats.Methods Mol Biol. 2009;573:285-309. doi: 10.1007/978-1-60761-247-6_16. Methods Mol Biol. 2009. PMID: 19763934 Review.
Cited by
-
Teaching neuroinformatics with an emphasis on quantitative locus analysis.J Undergrad Neurosci Educ. 2012 Fall;11(1):A119-25. Epub 2012 Oct 15. J Undergrad Neurosci Educ. 2012. PMID: 23493834 Free PMC article.
-
A multi-platform draft de novo genome assembly and comparative analysis for the Scarlet Macaw (Ara macao).PLoS One. 2013 May 8;8(5):e62415. doi: 10.1371/journal.pone.0062415. Print 2013. PLoS One. 2013. PMID: 23667475 Free PMC article.
-
Shaping vulnerability to addiction - the contribution of behavior, neural circuits and molecular mechanisms.Neurosci Biobehav Rev. 2018 Feb;85:117-125. doi: 10.1016/j.neubiorev.2017.05.019. Epub 2017 May 29. Neurosci Biobehav Rev. 2018. PMID: 28571877 Free PMC article. Review.
-
Disruption to schizophrenia-associated gene Fez1 in the hippocampus of HDAC11 knockout mice.Sci Rep. 2017 Sep 19;7(1):11900. doi: 10.1038/s41598-017-11630-1. Sci Rep. 2017. PMID: 28928414 Free PMC article.
-
Discovery of Novel Pain Regulators Through Integration of Cross-Species High-Throughput Data.CNS Neurosci Ther. 2025 Feb;31(2):e70255. doi: 10.1111/cns.70255. CNS Neurosci Ther. 2025. PMID: 39924344 Free PMC article.
References
-
- Bartzokis G, Tishler TA, Shin IS, Lu PH, Cummings JL. Brain ferritin iron as a risk factor for age at onset in neurodegenerative diseases. Ann N Y Acad Sci. 2004;1012:224–236. - PubMed
-
- Beckmann H, Lauer M. The human striatum in schizophrenia. II. Increased number of striatal neurons in schizophrenics. Psychiatry Res. 1997;68:99–109. - PubMed
-
- Belknap JK. Effect of within-strain sample size on QTL detection and mapping using recombinant inbred mouse strains. Behav Genet. 1998;28:29–38. - PubMed
Publication types
MeSH terms
Grants and funding
LinkOut - more resources
Full Text Sources
Molecular Biology Databases
Research Materials
Miscellaneous
