. 2009 Sep;128(1 Suppl):e471-8.
doi: 10.1111/j.1365-2567.2008.03001.x. Epub 2008 Dec 17.

Cytotoxic T-lymphocyte antigen 4 blockade augments the T-cell response primed by attenuated Listeria monocytogenes resulting in more rapid clearance of virulent bacterial challenge

Affiliations

Cytotoxic T-lymphocyte antigen 4 blockade augments the T-cell response primed by attenuated Listeria monocytogenes resulting in more rapid clearance of virulent bacterial challenge

Jared H Rowe et al. Immunology. 2009 Sep.

Abstract

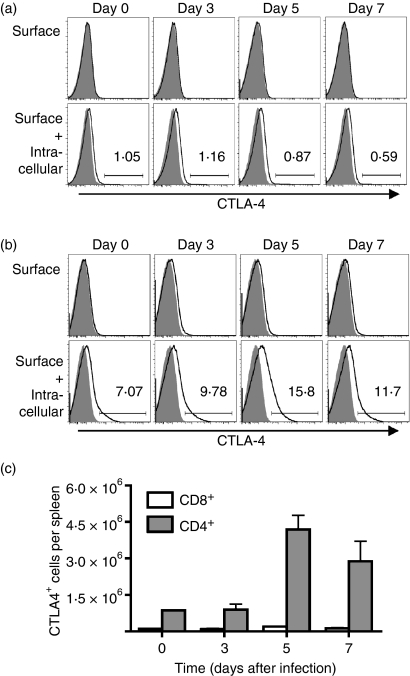
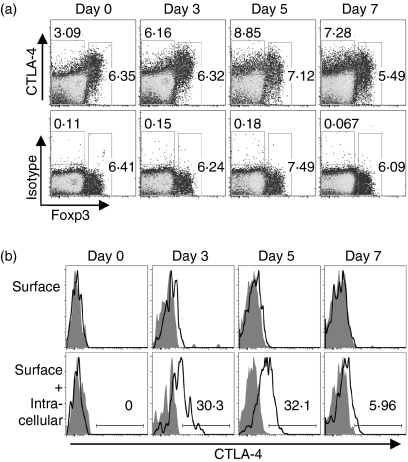
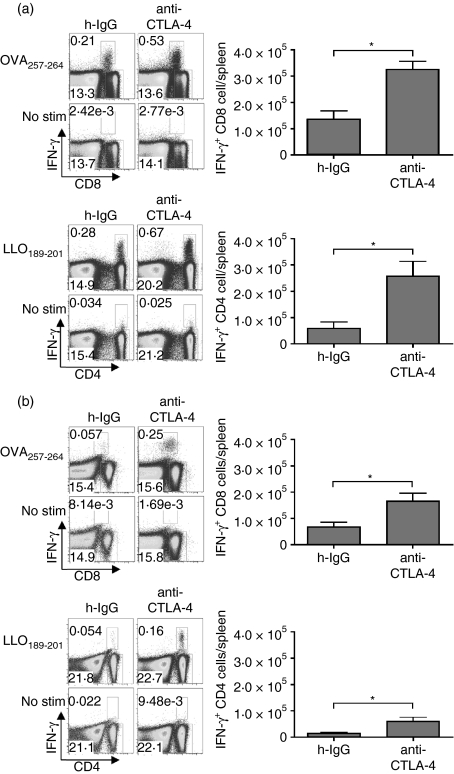
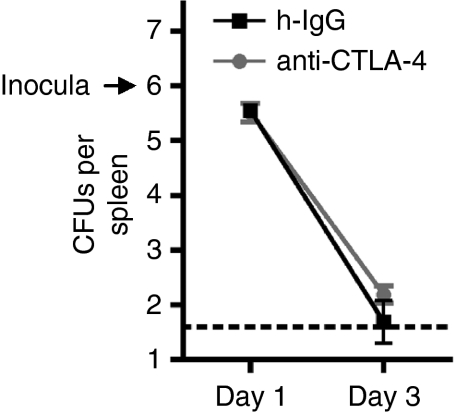
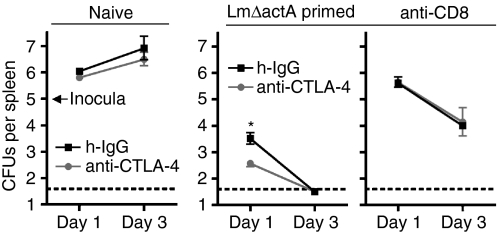
Cytotoxic T-lymphocyte antigen 4 (CTLA-4) uniformly suppresses antigen-specific T cells during chronic infection with bacterial, parasitic or viral pathogens. However, the importance of CTLA-4 in controlling the T-cell response during acute infection or after priming with live attenuated vaccine vectors has not been well characterized. Since strategies aimed at blocking CTLA-4 are being actively developed to therapeutically augment T-cell-mediated immunity, the effects of CTLA-4 blockade on T-cell activation during these conditions need to be more clearly defined. We have examined the role of CTLA-4 in a prime-challenge model of acute bacterial infection using both attenuated and virulent strains of the intracellular bacterium Listeria monocytogenes. Although Foxp3(+) CD4(+) T cells are the predominant CTLA-4-expressing cell type in naïve mice, antigen-specific Foxp3(-) CD4(+) cells upregulate CTLA-4 expression after primary L. monocytogenes infection. Blockade of CTLA-4 results in increased numbers of L. monocytogenes-specific CD4 and CD8 T cells after primary infection with attenuated L. monocytogenes, and confers more rapid bacterial clearance after secondary challenge with virulent L. monocytogenes. Accordingly, CTLA-4 plays an important suppressive role in T-cell priming and protective immunity in a prime-challenge model of acute bacterial infection.


Figures

Figure 1
Figure 1
Cytotoxic T-lymphocyte antigen 4 (CTLA-4) expression among CD8+ T cells (a) and CD4+ T cells (b) at the indicated time-points after infection with 106Listeria monocytogenes ovalbumin (Lm-OVA) ΔactA. CTLA-4 expression was measured by staining with anti-CTLA-4 antibody (open histograms) or isotype control antibody (shaded histograms) either before cell permeabilization (surface), or staining before and after permeabilization (surface + intracellular). The numbers indicate the percentage of CTLA-4+ cells compared with isotype control antibody. (c) Absolute number of CTLA-4+ CD8 and CD4 T cells among splenocytes at the indicated time-points after Lm-OVA ΔactA infection. These data are representative of four to six mice per time-point from two independent experiments with similar results. Bar indicates standard error.
Figure 2
Figure 2
(a) Cytotoxic T-lymphocyte antigen 4 (CTLA-4) expression determined by both cell surface and intracellular staining compared with Foxp3 expression among CD4+ T cells at the indicated time-points after infection with 106Listeria monocytogenes ovalbumin (Lm-OVA) ΔactA. The numbers indicate the percentage of CD4+ cells in each gate and are representative of four mice per time-point from two independent experiments. (b) Histogram plots indicating CTLA-4 expression among OT-II CD90.1+ OVA323–339-specific CD4+ T cells at the indicated time-points after infection. CTLA-4 expression was measured by staining with anti-CTLA-4 antibody (open histograms) or isotype control antibody (shaded histograms) either before cell permeabilization (surface), or staining before and after permeabilization (surface + intracellular). The numbers indicate the percentage CTLA-4+ cells compared with isotype control antibody, and is representative of four to six mice per time-point from two independent experiments with similar results.
Figure 3
Figure 3
(a) Percentage and total number of interferon-γ (IFN-γ) producing CD8+ (top) and CD4+ (bottom) T cells among splenocytes from mice treated with hamster isotype control immunoglobulin G (h-IgG) or cytotoxic T-lymphocyte antigen 4 (CTLA-4) blocking antibodies on day 8 after infection with 106Listeria monocytogenes ovalbumin (Lm-OVA) ΔactA and stimulation with OVA257–264 peptide [major histocompatibility complex (MHC) class I], lipid-linked oligosaccharide 189–201 peptide (LLO189–201 MHC class II), or no stimulation. (b) Percentage and total number of IFN-γ-producing CD8+ (top) and CD4+ (bottom) T cells among splenocytes from hamster isotype control (h-IgG) or CTLA-4 blocking antibody-treated mice on day 30 after infection with 106 Lm-OVA ΔactA and stimulation with OVA257–264 peptide (MHC class I), LLO189–201 peptide (MHC class II), or no stimulation. These data are representative of six mice per experimental group from two independent experiments with similar results. Bar represents standard error. *P < 0·05.
Figure 4
Figure 4
Number of recoverable Listeria monocytogenes colony-forming units (CFUs; log 10) per spleen for cytotoxic T-lymphocyte antigen 4 (CTLA-4) blocking antibody (•, grey line) or hamster isotype control (h-IgG, ▮, black line) antibody-treated mice after infection with 106Listeria monocytogenes ovalbumin (Lm-OVA) ΔactA. These data are representative of four mice per experimental group. Bar, standard error.
Figure 5
Figure 5
Number of recoverable Listeria monocytogenes CFUs (log 10) per spleen at the indicated time-point after infection with 105Listeria monocytogenes ovalbumin (Lm-OVA) for naïve mice (left-sided panel), mice primed 30 days previously with 106 Lm-OVA ΔactA (middle panel), and Lm-OVA ΔactA-primed mice depleted of CD8 T cells one day before challenge (right-sided panel) each treated with cytotoxic T-lymphocyte antigen 4 (CTLA-4) blocking (•, grey line) or hamster isotype control (h-IgG, ▮, black line) antibody. These data are representative of six to eight mice per experimental group from two independent experiments with similar results. Bar, standard error. *P < 0·05.

References

    1. Kearney ER, Walunas TL, Karr RW, Morton PA, Loh DY, Bluestone JA, Jenkins MK. Antigen-dependent clonal expansion of a trace population of antigen-specific CD4+ T cells in vivo is dependent on CD28 costimulation and inhibited by CTLA-4. J Immunol. 1995;155:1032–6. - PubMed
    1. Walsh CM, Smith P, Fallon PG. Role for CTLA-4 but not CD25+ T cells during Schistosoma mansoni infection of mice. Parasite Immunol. 2007;29:293–308. - PubMed
    1. Kirman J, McCoy K, Hook S, Prout M, Delahunt B, Orme I, Frank A, Le Gros G. CTLA-4 blockade enhances the immune response induced by mycobacterial infection but does not lead to increased protection. Infect Immun. 1999;67:3786–92. - PMC - PubMed
    1. Jacobs T, Graefe SE, Niknafs S, Gaworski I, Fleischer B. Murine malaria is exacerbated by CTLA-4 blockade. J Immunol. 2002;169:2323–9. - PubMed
    1. Lepenies B, Gaworski I, Tartz S, Langhorne J, Fleischer B, Jacobs T. CTLA-4 blockade differentially influences the outcome of non-lethal and lethal Plasmodium yoelii infections. Microbes Infect. 2007;9:687–94. - PubMed

Publication types

MeSH terms