

Discordant fibrin formation in hemophilia
- PMID: 19192107
- PMCID: PMC3400970
- DOI: 10.1111/j.1538-7836.2009.03306.x
Discordant fibrin formation in hemophilia
Abstract
Background: The conversion of fibrinogen to fibrin and its crosslinking to form a stable clot are key events in providing effective hemostasis.
Objectives: To evaluate the relationship of fibrinopeptide (FP) release and factor (F) XIII activation in whole blood from hemophiliacs.
Patients/methods: We investigated FPA and FPB release, FXIII activation and fibrin mass in tissue factor-initiated coagulation in whole blood from individuals with hemophilia and healthy subjects.
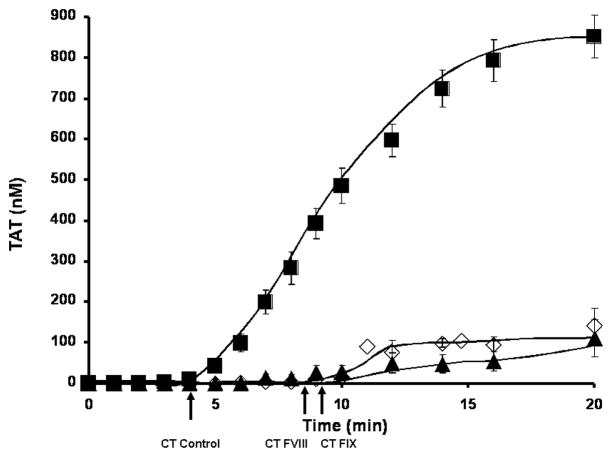
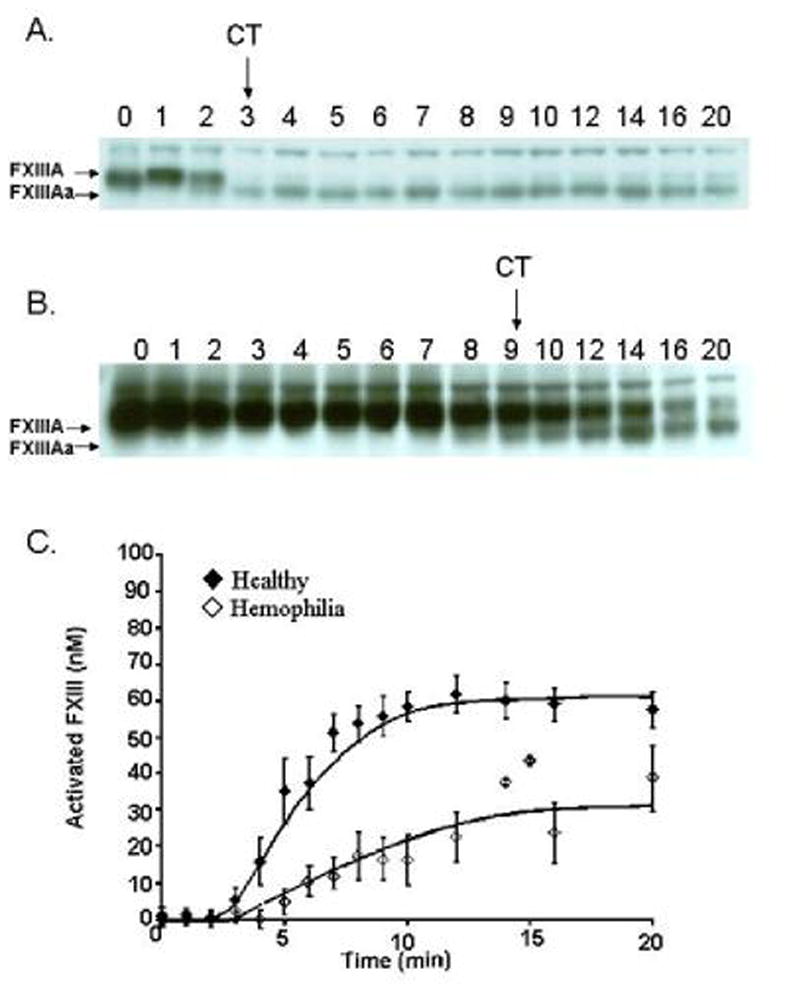
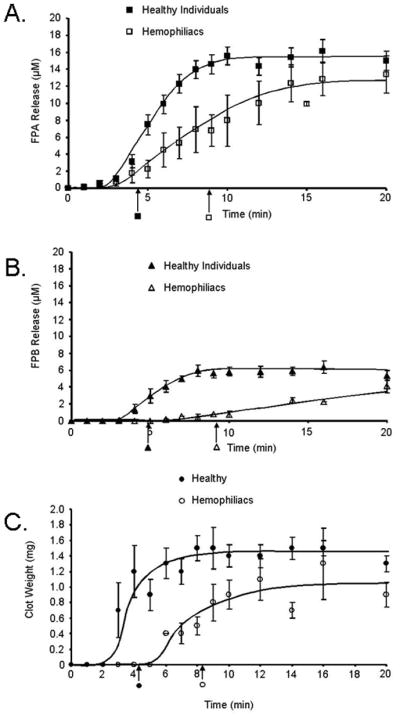
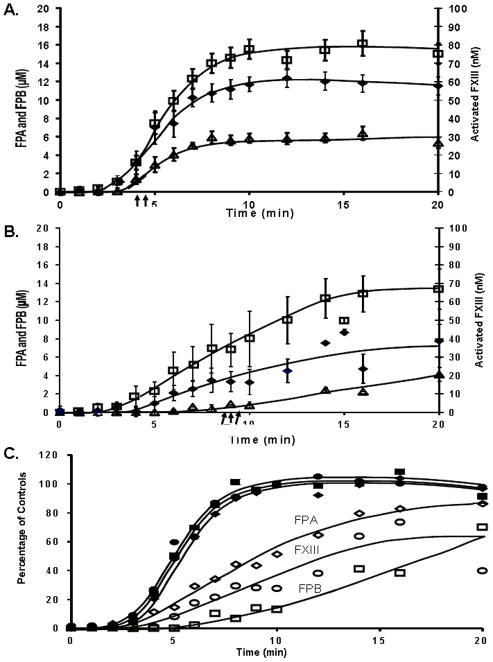
Results: In hemophiliacs, the rates of fibrin formation were delayed as compared to healthy individuals. FPA/FPB release and FXIII activation were decreased in hemophiliacs vs. healthy individuals: 5.4 +/- 0.7 microM min(-1) to 1.7 +/- 0.4 microM min(-1) (P = 0.003), 2.3 +/- 0.6 microM min(-1) to 0.5 +/- 0.1 microM min(-1) (P = 0.025), and 12.1 +/- 0.7 nM min(-1) to 3.1 +/- 0.7 nM min(-1) (P < 0.0005), respectively. More FPA was released in hemophiliacs (6.6 +/- 1.2 microM) prior to clot time (CT) than in healthy individuals (2.6 +/- 0.4 microM, P = 0.013), whereas FPB and activated FXIII levels remained comparable. FXIII activation, which normally coincides with FPA release, was delayed in hemophiliacs. At CT in normal blood, the FPA concentration was 2.6-fold higher than that of FPB (P = 0.003), whereas in hemophiliacs this ratio was increased to 6.6-fold (P = 0.001).
Conclusions: These data suggest that essential dynamic correlations exist between the presentations of fibrin I, fibrin II, and FXIIIa. The 'discordance' of fibrin formation in hemophiliacs results in clots that are more soluble than normal (43% lower mass; P = 0.02). The resulting poor physical clot strength probably plays a crucial role in the pathology of hemophilia.
Figures
Similar articles
-
Factor XIII cotreatment with hemostatic agents in hemophilia A increases fibrin α-chain crosslinking.J Thromb Haemost. 2018 Jan;16(1):131-141. doi: 10.1111/jth.13887. Epub 2017 Nov 20. J Thromb Haemost. 2018. PMID: 29080382 Free PMC article.
-
An integrated study of fibrinogen during blood coagulation.J Biol Chem. 1999 Aug 6;274(32):22862-70. doi: 10.1074/jbc.274.32.22862. J Biol Chem. 1999. PMID: 10428872
-
Thrombin generation and fibrin clot formation under hypothermic conditions: an in vitro evaluation of tissue factor initiated whole blood coagulation.J Crit Care. 2014 Feb;29(1):24-30. doi: 10.1016/j.jcrc.2013.10.010. Epub 2013 Oct 29. J Crit Care. 2014. PMID: 24331944 Free PMC article.
-
Factor XIII and Fibrin Clot Properties in Acute Venous Thromboembolism.Int J Mol Sci. 2021 Feb 5;22(4):1607. doi: 10.3390/ijms22041607. Int J Mol Sci. 2021. PMID: 33562624 Free PMC article. Review.
-
Functional impact of oxidative posttranslational modifications on fibrinogen and fibrin clots.Free Radic Biol Med. 2013 Dec;65:411-418. doi: 10.1016/j.freeradbiomed.2013.06.039. Epub 2013 Jul 11. Free Radic Biol Med. 2013. PMID: 23851017 Free PMC article. Review.
Cited by
-
Deletion of Coagulation Factor IX Compromises Bone Mass and Strength: Murine Model of Hemophilia B (Christmas Disease).Calcif Tissue Int. 2021 Nov;109(5):577-585. doi: 10.1007/s00223-021-00872-x. Epub 2021 Jun 12. Calcif Tissue Int. 2021. PMID: 34117910 Free PMC article.
-
Mechanisms of fibrin polymerization and clinical implications.Blood. 2013 Mar 7;121(10):1712-9. doi: 10.1182/blood-2012-09-306639. Epub 2013 Jan 10. Blood. 2013. PMID: 23305734 Free PMC article. Review.
-
Fluorescence artifact correction in the thrombin generation assay: Necessity for correction algorithms in procoagulant samples.Res Pract Thromb Haemost. 2021 Mar 26;5(3):447-455. doi: 10.1002/rth2.12499. eCollection 2021 Mar. Res Pract Thromb Haemost. 2021. PMID: 33870030 Free PMC article.
-
In silico thrombin generation: Plasma composition imbalance and mortality in human immunodeficiency virus.Res Pract Thromb Haemost. 2018 Sep 11;2(4):708-717. doi: 10.1002/rth2.12147. eCollection 2018 Oct. Res Pract Thromb Haemost. 2018. PMID: 30349890 Free PMC article.
-
Modeling thrombin generation: plasma composition based approach.J Thromb Thrombolysis. 2014 Jan;37(1):32-44. doi: 10.1007/s11239-013-1006-9. J Thromb Thrombolysis. 2014. PMID: 24214371 Review.
References
-
- Bolton-Maggs PH, Pasi KJ. Haemophilias A and B. Lancet. 2003;361:1801–1809. - PubMed
-
- Hoyer LW. Hemophilia A. N Engl J Med. 1994;330:38–47. - PubMed
-
- Castaldo G, Nardiello P, Bellitti F, Santamaria R, Rocino A, Coppola A, Di Minno G, Salvatore F. Haemophilia B: from molecular diagnosis to gene therapy. Clin Chem Lab Med. 2003;41:445–451. - PubMed
-
- Mann KG, Krishnaswamy S, Lawson JH. Surface-dependent hemostasis. Semin Hematol. 1992;29:213–226. - PubMed
-
- Lawson JH, Mann KG. Cooperative activation of human factor IX by the human extrinsic pathway of blood coagulation. J Biol Chem. 1991;266:11317–11327. - PubMed
Publication types
MeSH terms
Substances
Grants and funding
LinkOut - more resources
Full Text Sources
Other Literature Sources
Medical
Miscellaneous
