. 2009 Mar 20;4(3):179-190.
doi: 10.1021/cb800258g.

Indo-1 derivatives for local calcium sensing

Affiliations

Indo-1 derivatives for local calcium sensing

Michael Bannwarth et al. ACS Chem Biol. .

Abstract

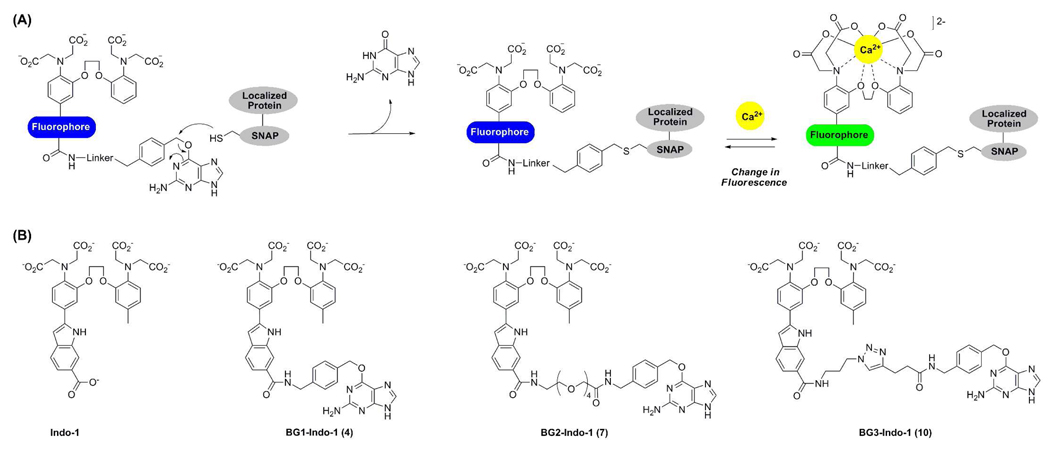
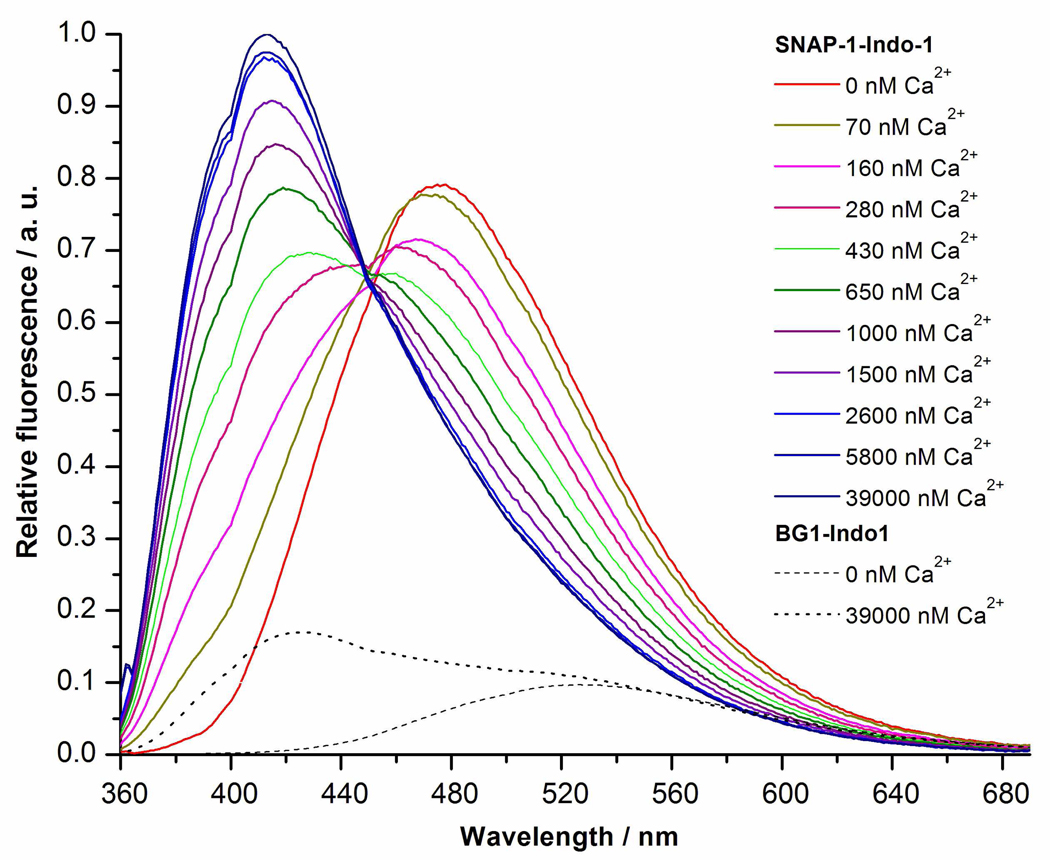
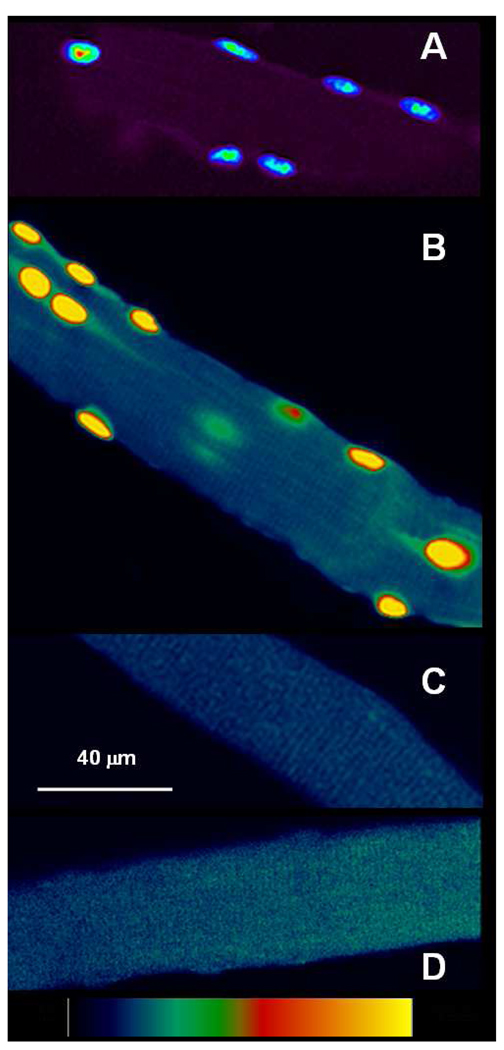
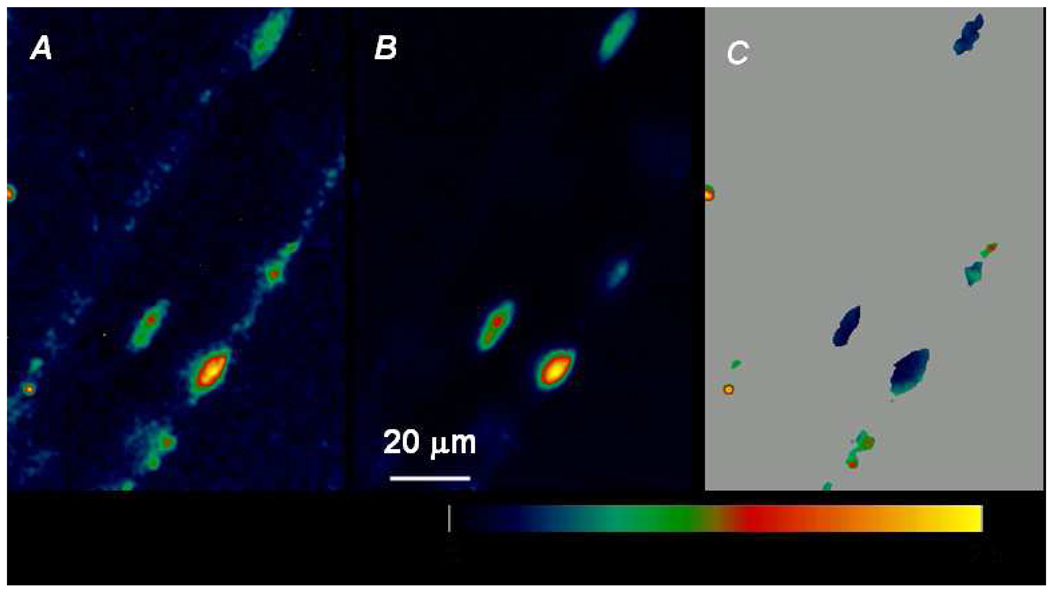
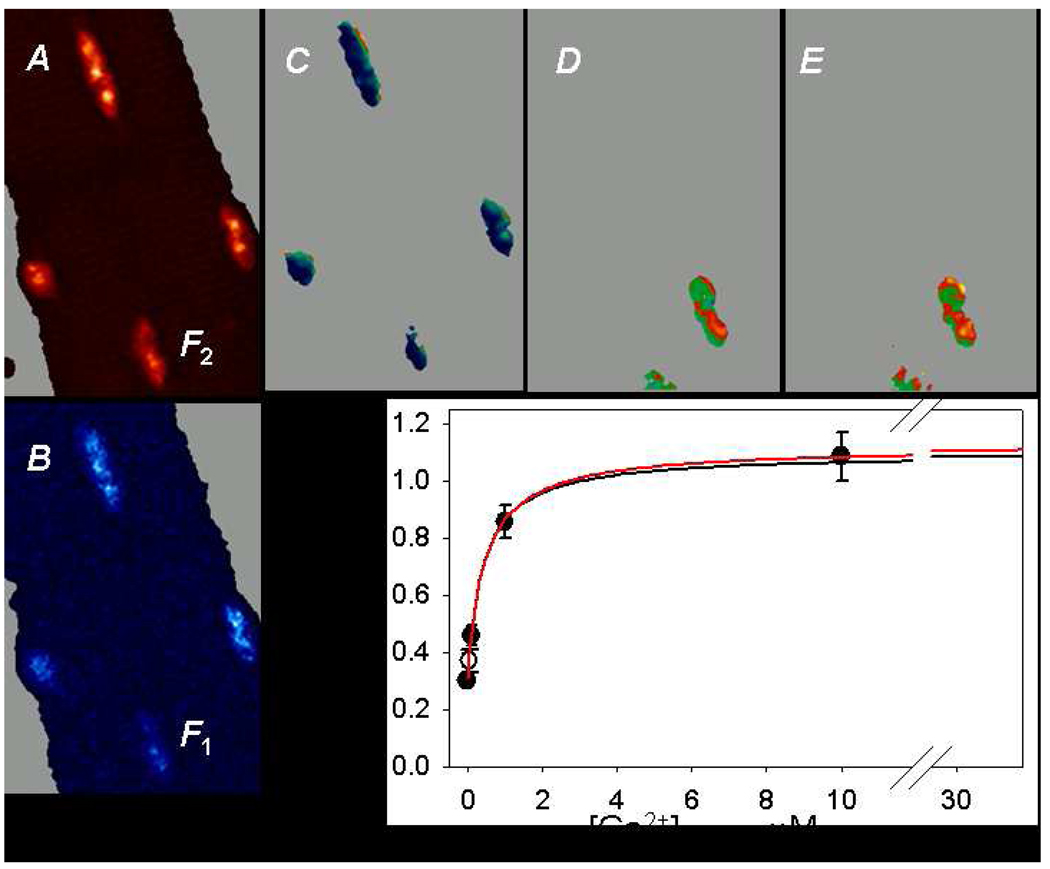
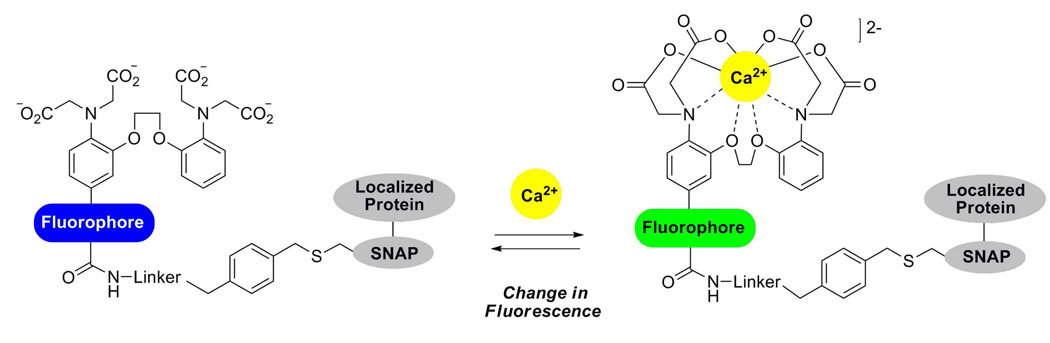
The role of calcium in signal transduction relies on the precise spatial and temporal control of its concentration. The existing means to detect fluctuations in Ca2+ concentrations with adequate temporal and spatial resolution are limited. We introduce here a method to measure Ca2+ concentrations in defined locations in living cells that is based on linking the Ca2+-sensitive dye Indo-1 to SNAP-tag fusion proteins. Fluorescence spectroscopy of SNAP-Indo-1 conjugates in vitro showed that the conjugates retained the Ca2+-sensing ability of Indo-1. In a proof-of-principle experiment, local Ca2+ sensing was demonstrated in single cells dissociated from muscle of adult mice expressing a nucleus-localized SNAP-tag fusion. Ca2+ concentrations inside nuclei of resting cells were measured by shifted excitation and emission ratioing of confocal microscopic images of fluorescence. After permeabilizing the plasma membrane, changes in the bathing solution induced corresponding changes in nuclear [Ca2+] that were readily detected and used for a preliminary calibration of the technique. This work thus demonstrates the synthesis and application of SNAP-tag-based Ca2+ indicators that combine the spatial specificity of genetically encoded calcium indicators with the advantageous spectroscopic properties of synthetic indicators.


Figures

Figure 1
Figure 1
Use of SNAP-tag technology for the localization of Indo-1 in living cells. (A) Mechanism for localizing Ca2+ indicators in cells via SNAP-tag fusion proteins; (B) Structure of Indo-1 and Indo-1 benzylguanine (BG) derivatives synthesized in this work.
Figure 2
Figure 2
Fluorescence spectra of SNAP-1-Indo-1 (200 nM) and BG1-Indo-1 at varying calcium concentrations with excitation at 350 nm. Both the wavelength shift upon calcium binding and the fluorescence emission intensity increase after the reaction of BG1-Indo-1 with SNAP-tag are clearly visible.
Figure 3
Figure 3
Localization of SNAP-tag in nuclei of muscle fibers. (A) Confocal image of fluorescence of a cell isolated from the FDB muscle of a mouse expressing SNAP-NLS. The cell had been briefly exposed to BG-DAF (1µM, 3–4 min). Image obtained at low excitation intensity (power of Ar laser at 488 nm was set at 3% of maximum). Fluorescence is emitted by fluorescein set free from hydrolysis of diacetylfluorescein (DAF), and is largely originated at nuclei. (B) Image of a different segment of the same fiber at greater excitation intensity (15%), to show staining outside nuclei, presumably by BG-DAF not bound to SNAP-NLS or cellular autofluorescence. (C) Fluorescence of a fiber not expressing SNAP-NLS but exposed to BG-DAF; image acquired at the same excitation intensity as B. Gain-determining photomultiplier voltage was the same in all cases. (D) Fluorescence of a fiber expressing SNAP-NLS but not exposed to BG-DAF, acquired at same excitation intensity and gain, but displayed in a color scale expanded 7-fold (i.e. the covered range is 0 to 36 units in this case). This image indicates that cellular autofluorescence level in D is ~ 15% of the background fluorescence in C.
Figure 4
Figure 4
Localization of SNAP-3-Indo-1 to myonuclei. (A, B) SEER image pair (F1 and F2) of a muscle cell expressing nuclear-targeted SNAP-tag, loaded with BG3-Indo-1/AM. The image in A is represented at 4x normal intensity to show that some extranuclear staining is present. (C) R = F1 / F2 restricted to regions where the sensor concentration was greater than a threshold. Three nuclei are well defined in both images and the value of R averaged over these nuclei corresponds to a [Ca2+]n = 109 nM. The color bar calibrates the R image in C.
Figure 5
Figure 5
Calibration of SNAP-3-Indo-1 in myonuclei. (A, B) SEER image pair in a membrane-permeabilized cell expressing SNAP-NLS, incubated with BG3-Indo-1/AM and then exposed to a 100 nM Ca2+ internal solution. (C–E) R = F1 / F2 (restricted to regions where the sensor concentration was greater than a threshold; same color table as in Figure 4C) for cell in A and B after exposure to internal solutions with [Ca2+] of 100 nM (C), 1 µM (D) or 100 µM (E). Incubation with 1μM or higher [Ca2+] led to cell movement and only 2 nuclei remained in focus. (F) Plot of averaged R vs [Ca2+] in internal solution after permeabilization (bars span ±S.E.M. in three cells, point at 0 nM represents a single measurement). The curve in red plots the best fit by eqn. 2 (Materials and Methods) with 3 free parameters, of values Rmin = 0.305, Rmax = 1.17 and γKD = 458 nM (and KD = 228 nM). The curve in black represents the constrained fit with Rmin = 0.301 (the reading at 0 [Ca2+]) and Rmax = 1.09 (the average reading at 10 µM). In this case γKD = 412 nM. The open circle plots the average value of R (±S.E.M.) in nine intact cells at the abscissa calculated with the unconstrained 3-parameter fit, yielding a [Ca2+]n of 37 nM.
Scheme 1
Scheme 1. Synthesis of BG1-Indo-1 (4) and BG2-Indo-1 (7)
(a) BG-NH2 (2), EDC, HOBt, DMF, rt, 12 h; (b) BG-PEG4-NH2 (5), EDC, HOBt, DMF, rt, 12 h; (c) 1 M KOH aq, THF/MeOH (4:1), 12 h. EDC = 1-(3-Dimethylaminopropyl)-3-ethylcarbodiimide hydrochloride, HOBt = 1-Hydroxybenzotriazole.
Scheme 1
Scheme 1. Synthesis of BG1-Indo-1 (4) and BG2-Indo-1 (7)
(a) BG-NH2 (2), EDC, HOBt, DMF, rt, 12 h; (b) BG-PEG4-NH2 (5), EDC, HOBt, DMF, rt, 12 h; (c) 1 M KOH aq, THF/MeOH (4:1), 12 h. EDC = 1-(3-Dimethylaminopropyl)-3-ethylcarbodiimide hydrochloride, HOBt = 1-Hydroxybenzotriazole.
Scheme 2
Scheme 2. Synthesis of BG3-Indo-1 (10) and BG3-Indo-1/AM (12)
(a) N3−(CH2)3−NH2, EDC, HOBt, DMF, rt, 1 h; (b) BG−≡ (9), CuSO4·5H2O, sodium ascorbate, CH2Cl2, iPrOH, H2O, 60°C, 24 h; (c) 1 M KOH aq, THF, 12 h; (d) 1 M KOH aq, THF, MeOH, 12 h; (e) 1 M HCl aq, 5 min; (f) bromomethyl acetate, DIPEA, 0°C, 2 h; (g) BG−≡ (9), CuSO4·5H2O, sodium ascorbate, CH2Cl2, iPrOH, H2O, rt, 48 h; EDC = 1-(3-Dimethylaminopropyl)-3-ethylcarbodiimide hydrochloride, HOBt = 1-Hydroxybenzotriazole, DIPEA = N,N-Diisopropylethylamine.

References

    1. Clapham DE. Calcium signaling. Cell. 2007;131:1047–1058. - PubMed
    1. Csordas G, Thomas AP, Hajnoczky G. Quasi-synaptic calcium signal transmission between endoplasmic reticulum and mitochondria. Embo J. 1999;18:96–108. - PMC - PubMed
    1. Niggli E, Shirokova N. A guide to sparkology: the taxonomy of elementary cellular Ca2+ signaling events. Cell Calcium. 2007;42:379–387. - PubMed
    1. Miyawaki A, Llopis J, Heim R, McCaffery JM, Adams JA, Ikura M, Tsien RY. Fluorescent indicators for Ca2+ based on green fluorescent proteins and calmodulin. Nature. 1997;388:882–887. - PubMed
    1. Romoser VA, Hinkle PM, Persechini A. Detection in living cells of Ca2+-dependent changes in the fluorescence emission of an indicator composed of two green fluorescent protein variants linked by a calmodulin-binding sequence. A new class of fluorescent indicators. J. Biol. Chem. 1997;272:13270–13274. - PubMed

Publication types

MeSH terms