. 2009 Feb;15(2):243-54.
doi: 10.1089/ten.tea.2008.0067.

Influence of three-dimensional hyaluronic acid microenvironments on mesenchymal stem cell chondrogenesis

Affiliations

Influence of three-dimensional hyaluronic acid microenvironments on mesenchymal stem cell chondrogenesis

Cindy Chung et al. Tissue Eng Part A. 2009 Feb.

Abstract

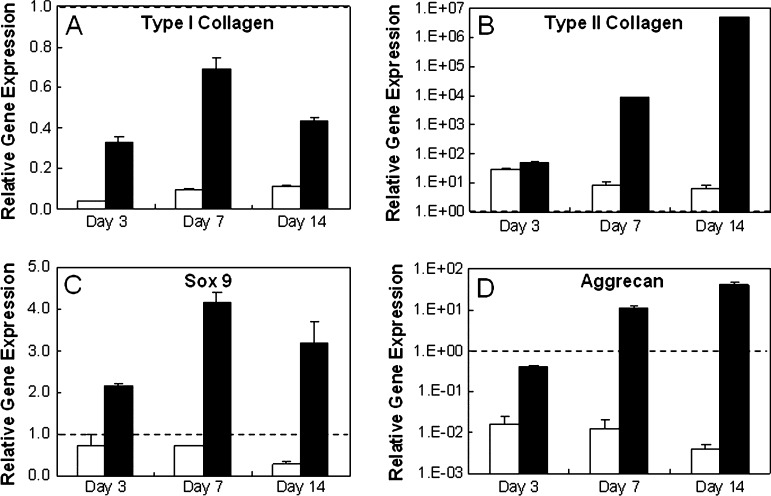
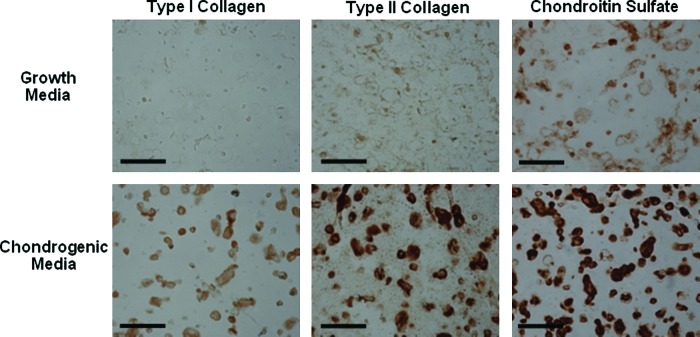
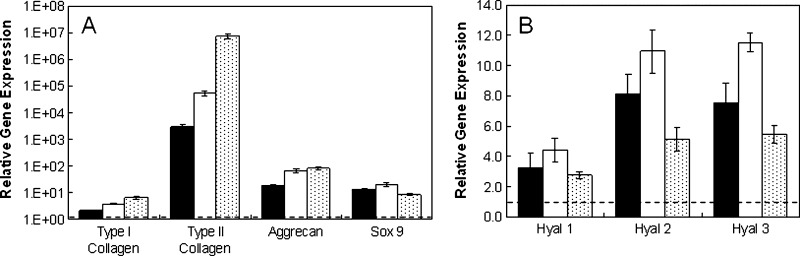
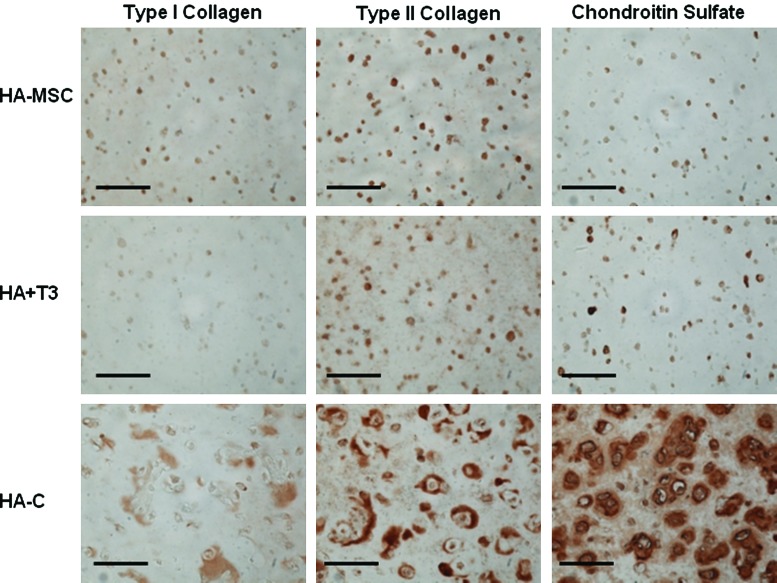
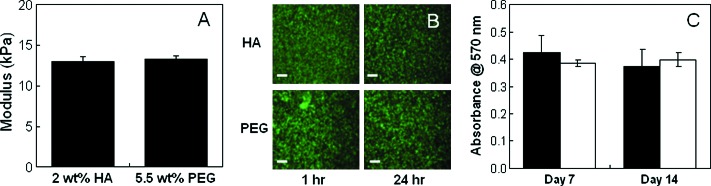
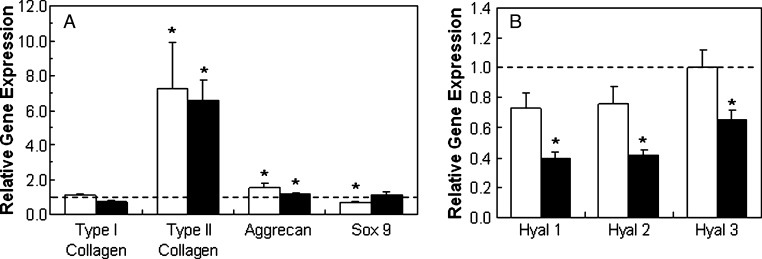
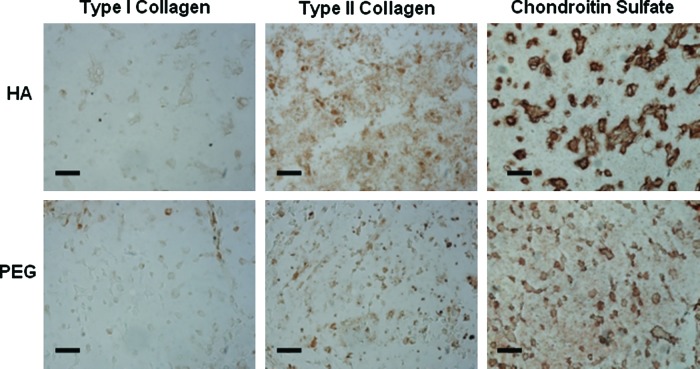
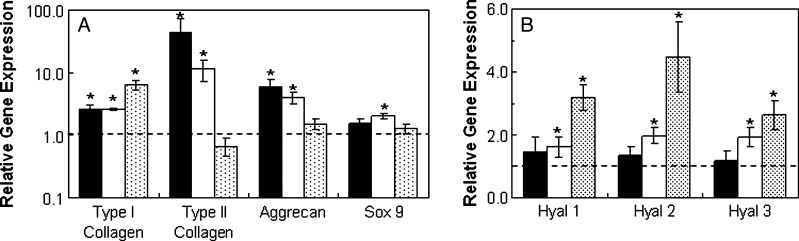
Mesenchymal stem cells (MSCs) are multipotent progenitor cells whose plasticity and self-renewal capacity have generated significant interest for applications in tissue engineering. The objective of this study was to investigate MSC chondrogenesis in photo-cross-linked hyaluronic acid (HA) hydrogels. Because HA is a native component of cartilage, and MSCs may interact with HA via cell surface receptors, these hydrogels could influence stem cell differentiation. In vitro and in vivo cultures of MSC-laden HA hydrogels permitted chondrogenesis, measured by the early gene expression and production of cartilage-specific matrix proteins. For in vivo culture, MSCs were encapsulated with and without transforming growth factor beta-3 (TGF-beta3) or pre-cultured for 2 weeks in chondrogenic medium before implantation. Up-regulation of type II collagen, aggrecan, and sox 9 was observed for all groups over MSCs at the time of encapsulation, and the addition of TGF-beta3 further enhanced the expression of these genes. To assess the influence of scaffold chemistry on chondrogenesis, HA hydrogels were compared with relatively inert poly(ethylene glycol) (PEG) hydrogels and showed enhanced expression of cartilage-specific markers. Differences between HA and PEG hydrogels in vivo were most noticeable for MSCs and polymer alone, indicating that hydrogel chemistry influences the commitment of MSCs to undergo chondrogenesis (e.g., approximately 43-fold up-regulation of type II collagen of MSCs in HA over PEG hydrogels). Although this study investigated only early markers of tissue regeneration, these results emphasize the importance of material cues in MSC differentiation microenvironments, potentially through interactions between scaffold materials and cell surface receptors.


Figures

FIG. 1.
FIG. 1.
CD44 expression by mesenchymal stem cells (MSCs) and MSC viability in methacrylated hyaluronic acid (MeHA) hydrogels. Immunofluorescence staining of CD44 (green) with nuclear counterstain (blue) of MSCs cultured in two dimensions on glass coverslips (scale bar = 100 μm) (A), flow cytometry staining for CD44 (yellow) compared with unstained (black) population of MSCs before encapsulation (B), and live (green)/dead (red) image of MSCs encapsulated in MeHA hydrogel 6 h after photopolymerization (scale bar = 200 μm) (C). Color images available online at www.liebertonline.com/ten.
FIG. 2.
FIG. 2.
Mesenchymal stem cell (MSC) chondrogenesis in methacrylated hyaluronic acid hydrogels in vitro. Relative gene expression of type I (A) and type II (B) collagen, sox 9 (C), and aggrecan (D) for MSCs encapsulated in hydrogels cultured in growth (white) and chondrogenic (black) media. Glyceraldehyde 3-phosphate dehydrogenase was used as the housekeeping gene, and expression was normalized to cells at the time of encapsulation (indicated by the dashed line). Gene expression of MSCs cultured in chondrogenic media was significantly different than that of MSCs cultured in growth medium (p < 0.05) for all genes at all time points.
FIG. 3.
FIG. 3.
Hyaluronidase (Hyal) expression of mesenchymal stem cell (MSC)-laden methacrylated hyaluronic acid hydrogels in vitro. Relative gene expression of Hyals for MSCs encapsulated in hydrogels cultured in growth (white) and chondrogenic (black) media. Glyceraldehyde 3-phosphate dehydrogenase was used as the housekeeping gene, and expression was normalized to cells at the time of encapsulation (indicated by the dashed line). *Significant differences (p < 0.05) between hydrogels cultured in growth and chondrogenic medium.
FIG. 4.
FIG. 4.
Immunohistochemistry of mesenchymal stem cell (MSC)-laden methacrylated hyaluronic acid hydrogels in vitro. Representative stains for type I and II collagen and chondroitin sulfate for MSC-laden hydrogels cultured in growth and chondrogenic media for 14 days in vitro. Scale bar = 100 μm. Color images available online at www.liebertonline.com/ten.
FIG. 5.
FIG. 5.
Mesenchymal stem cell (MSC)-laden methacrylated hyaluronic acid (HA) hydrogels in vivo. Relative gene expression for type I and type II collagen, aggrecan, sox 9 (A), and hyaluronidases (B) for MSCs encapsulated in hydrogels cultured 2 weeks in vivo. Glyceraldehyde 3-phosphate dehydrogenase was used as the housekeeping gene, and expression was normalized to cells at the time of encapsulation (indicated by the dashed line). The groups included the hydrogel alone (HA-MSC, black), hydrogels with transforming growth factor beta-3 co-encapsulated with cells (HA + T3, white), and hydrogels pre-cultured in chondrogenic medium for 2 weeks (HA-C, shaded). All groups were significantly different (p < 0.05) for type I and II collagen, whereas HA-MSC was significantly different from HA + T3 and HA-C for aggrecan. In addition, HA + T3 was significantly different from HA-C for hyaluronidase 2 and 3 and sox 9.
FIG. 6.
FIG. 6.
Immunohistochemistry of mesenchymal stem cell (MSC)-laden methacrylated hyaluronic acid (HA) hydrogels in vivo. Representative stains for type I and II collagen and chondroitin sulfate for hydrogel alone (HA-MSC), hydrogels with transforming growth factor beta-3 co-encapsulated with cells (HA + T3), and hydrogels pre-cultured in chondrogenic medium for 2 weeks (HA-C) groups after 3 week culture in vivo. Scale bar = 100 μm. Color images available online at www.liebertonline.com/ten.
FIG. 7.
FIG. 7.
Methacrylated hyaluronic acid (HA) compared with polyethylene glycol (PEG). Modulus of acellular HA and PEG hydrogels (A), live (green)/dead (red) images of mesenchymal stem cell–laden hydrogels at 1 and 24 h after polymerization; scale bar = 200 μm (B), relative mitochondrial activity for HA (black) and PEG (white) hydrogels after 7 and 14 days of in vitro culture (C). There were no statistical differences in hydrogel moduli and viability between the HA and PEG groups. Color images available online at www.liebertonline.com/ten.
FIG. 8.
FIG. 8.
Methacrylated hyaluronic acid (HA) compared with polyethylene glycol (PEG) in vitro. Relative gene expression of type I and type II collagen, sox 9, and aggrecan (A) and hyaluronidases (B) for mesenchymal stem cells encapsulated in HA hydrogels cultured in vitro in chondrogenic media for 7 (white) and 14 days (black). Glyceraldehyde 3-phosphate dehydrogenase was used as the housekeeping gene, and expression was normalized to PEG counterparts (indicated by the dashed line). *Significant differences (p < 0.05) between HA and PEG hydrogels.
FIG. 9.
FIG. 9.
Immunohistochemistry of mesenchymal stem cell (MSC)-laden methacrylated hyaluronic acid (HA) and polyethylene glycol (PEG) hydrogels in vitro. Representative stains for type I and II collagen and chondroitin sulfate for MSC-laden HA and PEG hydrogels cultured in chondrogenic medium for 14 days in vitro. Scale bar = 200 μm. Color images available online at www.liebertonline.com/ten.
FIG. 10.
FIG. 10.
Methacrylated hyaluronic acid (HA) compared with polyethylene glycol (PEG) in vivo. Relative gene expression for type I and II collagen, aggrecan, sox 9 (A), and hyaluronidases (B) of mesenchymal stem cells (MSCs) in hydrogel alone (HA-MSC, black), hydrogels with transforming growth factor beta-3 co-encapsulated with cells (HA + T3, white), and hydrogels pre-cultured in chondrogenic medium for 2 weeks (HA-C, shaded) groups cultured in vivo for 2 weeks. Glyceraldehyde 3-phosphate dehydrogenase was used as the housekeeping gene, and expression was normalized to PEG counterparts (indicated by the dashed line). *Significant differences (p < 0.05) between HA and PEG hydrogels.

References

    1. Pittenger M.F. Mackay A.M. Beck S.C. Jaiswal R.K. Douglas R. Mosca J.D. Moorman M.A. Simonetti D.W. Craig S. Marshak D.R. Multilineage potential of adult human mesenchymal stem cells. Science. 1999;284:143. - PubMed
    1. Friedenstein A.J. Gorskaja J.F. Kulagina N.N. Fibroblast precursors in normal and irradiated mouse hematopoietic organs. Exp Hematol. 1976;4:267. - PubMed
    1. Alhadlaq A. Mao J.J. Mesenchymal stem cells: isolation and therapeutics. Stem Cells Dev. 2004;13:436. - PubMed
    1. Zuk P.A. Zhu M. Ashjian P. De Ugarte D.A. Huang J.I. Mizuno H. Alfonso Z.C. Fraser J.K. Benhaim P. Hedrick M.H. Human adipose tissue is a source of multipotent stem cells. Mol Biol Cell. 2002;13:4279. - PMC - PubMed
    1. Ashton B.A. Allen T.D. Howlett C.R. Eaglesom C.C. Hattori A. Owen M. Formation of bone and cartilage by marrow stromal cells in diffusion chambers in vivo. Clin Orthop Relat Res. 1980:294. - PubMed

Publication types

LinkOut - more resources