. 2009 Feb 4:9:30.
doi: 10.1186/1471-2148-9-30.

Species delimitation in lemurs: multiple genetic loci reveal low levels of species diversity in the genus Cheirogaleus

Affiliations

Species delimitation in lemurs: multiple genetic loci reveal low levels of species diversity in the genus Cheirogaleus

Linn F Groeneveld et al. BMC Evol Biol. .

Abstract

Background: Species are viewed as the fundamental unit in most subdisciplines of biology. To conservationists this unit represents the currency for global biodiversity assessments. Even though Madagascar belongs to one of the top eight biodiversity hotspots of the world, the taxonomy of its charismatic lemuriform primates is not stable. Within the last 25 years, the number of described lemur species has more than doubled, with many newly described species identified among the nocturnal and small-bodied cheirogaleids. Here, we characterize the diversity of the dwarf lemurs (genus Cheirogaleus) and assess the status of the seven described species, based on phylogenetic and population genetic analysis of mtDNA (cytb + cox2) and three nuclear markers (adora3, fiba and vWF).

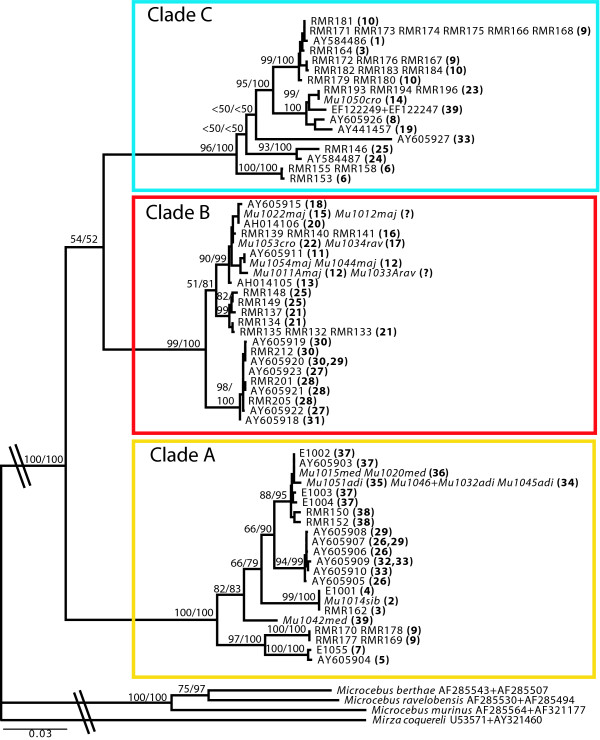
Results: This study identified three distinct evolutionary lineages within the genus Cheirogaleus. Population genetic cluster analyses revealed a further layer of population divergence with six distinct genotypic clusters.

Conclusion: Based on the general metapopulation lineage concept and multiple concordant data sets, we identify three exclusive groups of dwarf lemur populations that correspond to three of the seven named species: C. major, C. medius and C. crossleyi. These three species were found to be genealogically exclusive in both mtDNA and nDNA loci and are morphologically distinguishable. The molecular and morphometric data indicate that C. adipicaudatus and C. ravus are synonymous with C. medius and C. major, respectively. Cheirogaleus sibreei falls into the C. medius mtDNA clade, but in morphological analyses the membership is not clearly resolved. We do not have sufficient data to assess the status of C. minusculus. Although additional patterns of population differentiation are evident, there are no clear subdivisions that would warrant additional specific status. We propose that ecological and more geographic data should be collected to confirm these results.


Figures

Figure 1
Figure 1
Sampling localities used in this study. Field samples collected by the authors are marked with circles. Presumed sites of origin for museum specimens are marked by triangles. Localities for GenBank samples are marked by squares. Symbols are colored according to the three main clades defined in the mtDNA gene tree (Fig. 2). More than one symbol can refer to one locality, if multiple species, or multiple types of data are found at one site. Detailed information for locality sites, marked by locality number, are given in Tables 1-3 and in Hapke et al. [25].
Figure 2
Figure 2
Maximum likelihood phylogram based on mtDNA. ML phylogram based on a total alignment of mtDNA cytb and cox2 haplotype sequences from field and museum samples (in italic) and of published GenBank samples. Tip labels contain the individual field numbers (E, RMR), the museum identifier, or GenBank accession number of sequences within a haplotype. The sampling locality a haplotype was found in, is given in bold type in parentheses, as marked in Fig. 1. GenBank haplotypes may occur in more than one locality. Maximum likelihood bootstrap values and Bayesian posterior probabilities are depicted above the branches.
Figure 3
Figure 3
adora3 haplotype network. Statistical parsimony haplotype network representing the genealogical relationships among 29 haplotypes of the adora3 locus generated from field-collected samples. Haplotypes are colored according to the respective sampling locality, with the locality number given in the legend in bold as marked in Fig. 1. The sizes of circles representing haplotypes reflect the number of sequences that share a haplotype. Each of the haplotypes is numbered. Inferred intermediate haplotypes, either not sampled, or extinct, are represented by small non-colored circles. Groups of haplotypes found in individuals that correspond to clades A, B and C in the mtDNA tree are outlined by the colored frames.
Figure 4
Figure 4
fiba haplotype network. Statistical parsimony haplotype network representing the genealogical relationships among 49 haplotypes of the fiba locus generated from field-collected samples. Haplotypes are colored according to the respective sampling locality, with the locality number given in the legend in bold as marked in Fig. 1. The sizes of circles representing haplotypes reflect the number of sequences that share a haplotype. Each haplotype is numbered. Inferred intermediate haplotypes, either not sampled, or extinct, are represented by small non-colored circles. Groups of haplotypes found in individuals that correspond to clades A, B and C in the mtDNA tree are outlined by the colored frames.
Figure 5
Figure 5
vWF haplotype network. Statistical parsimony haplotype network representing the genealogical relationships among 52 haplotypes of the vWF locus generated from field-collected samples. Haplotypes are colored according to the respective sampling locality, with the locality number given in the legend in bold as marked in Fig. 1. The sizes of circles representing haplotypes reflect the number of sequences that share a haplotype. Each haplotype is numbered. Inferred intermediate haplotypes, either not sampled, or extinct, are represented by small non-colored circles. Groups of haplotypes found in individuals that correspond to clades A, B and C in the mtDNA tree are outlined by the colored frames.
Figure 6
Figure 6
Bayesian population structure analysis. Bayesian assignment of the 48 field-collected individuals to populations, based on three nuclear loci, assuming a population number of K = 6. Individuals are arrayed along the x-axis. The y-axis denotes the cumulative posterior probability of an individual's placement in particular population(s). Individuals are divided into sampled populations by thin black lines. Sampled populations are labeled at the bottom with numbers in parentheses corresponding to the sampling locality as marked in Fig. 1.

References

    1. Ryder OA. Species conservation and systematics: The dilemma of subspecies. Trends Ecol Evol. 1986;1:9–10. doi: 10.1016/0169-5347(86)90059-5. - DOI - PubMed
    1. Moritz C. Defining 'Evolutionarily Significant Units' for conservation. Trends Ecol Evol. 1994;9:373–375. doi: 10.1016/0169-5347(94)90057-4. - DOI - PubMed
    1. Sechrest W, Brooks TM, da Fonseca GAB, Konstant WR, Mittermeier RA, Purvis A, Rylands AB, Gittleman JL. Hotspots and the conservation of evolutionary history. Proc Natl Acad Sci USA. 2002;99:2067–2071. doi: 10.1073/pnas.251680798. - DOI - PMC - PubMed
    1. Cracraft J. Current Ornithology. Vol. 1. Johnston RF: Plenum Press; 1983. Species concepts and speciation analysis; pp. 159–187.
    1. Nixon KC, Wheeler QD. An amplification of the phylogenetic species concept. Cladistics. 1990;6:211–223. doi: 10.1111/j.1096-0031.1990.tb00541.x. - DOI

Publication types

Substances