

Combined TLR2 and TLR4 ligation in the context of bacterial or helminth extracts in human monocyte derived dendritic cells: molecular correlates for Th1/Th2 polarization
- PMID: 19193240
- PMCID: PMC2672924
- DOI: 10.1186/1471-2172-10-9
Combined TLR2 and TLR4 ligation in the context of bacterial or helminth extracts in human monocyte derived dendritic cells: molecular correlates for Th1/Th2 polarization
Abstract
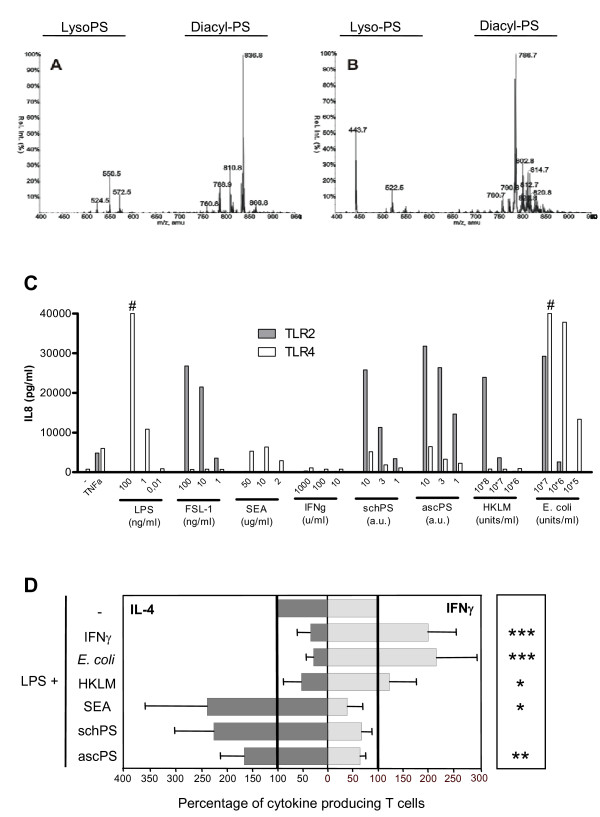
Background: Recognition of pathogens by dendritic cells (DCs) through interaction with pattern recognition receptors, including Toll like receptors (TLR), is crucial for the initiation of appropriate polarized T helper (Th) cell responses. Yet, the characteristics and differences in molecular profiles of DCs with different T cell polarizing capacities are still poorly defined. To address this issue, the molecular profile of human monocyte derived DCs was characterized after exposure to TLR4 ligand LPS in combination with the Th1 promoting bacterial extracts from Listeria monocytogenes and Escherichia coli or the Th2 promoting helminth derived phospholipids from Schistosoma mansoni and Ascaris lumbricoides, all with TLR2 activating capacity.
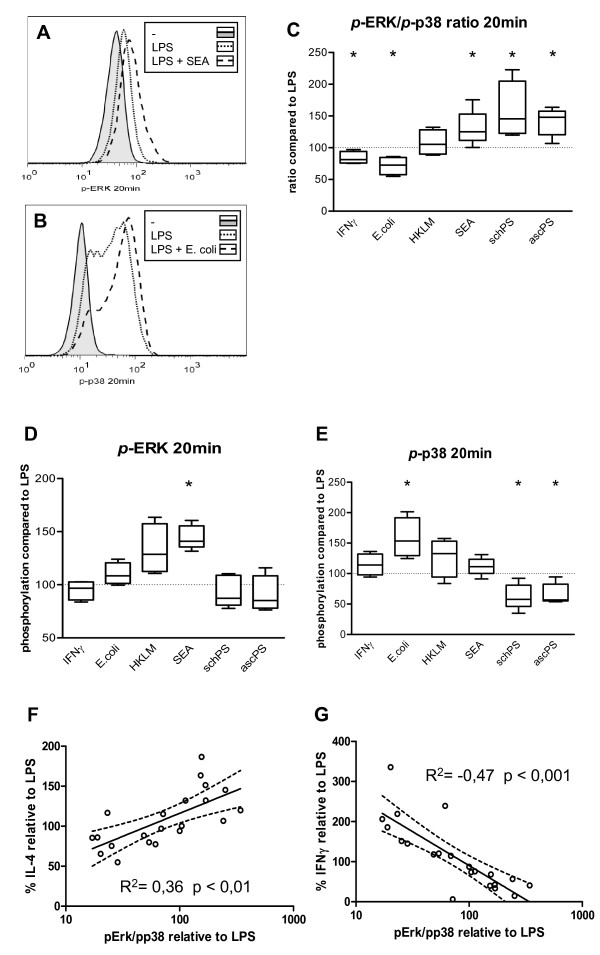
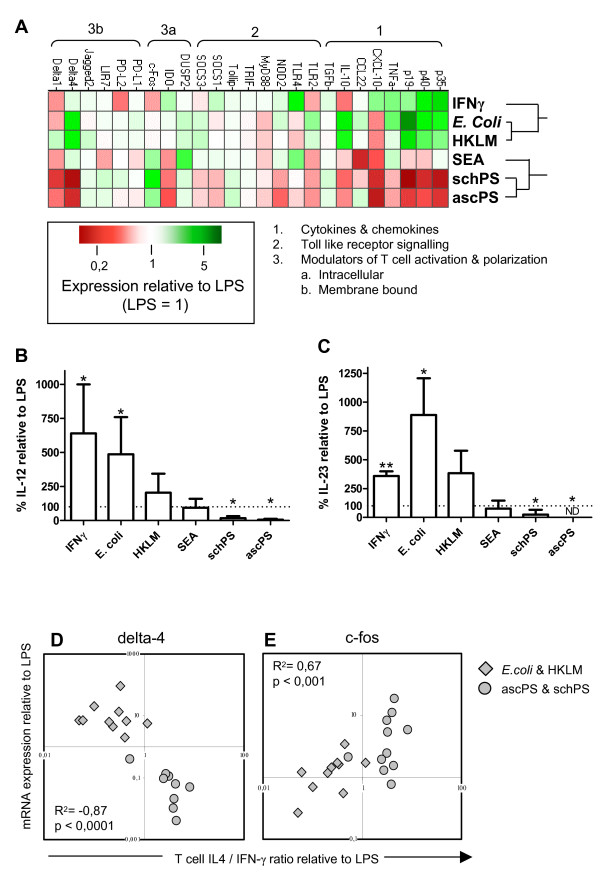
Results: With regard to the signalling pathways activated upon exposure to LPS and the TLR2 activating compounds, we find that the ratio of activated Mitogen Activated Protein Kinases (MAPK) p-ERK/p-p38 is lower in DCs stimulated with the bacterial products compared to DCs stimulated with the helminth products, which correlates with the Th1 and Th2 polarizing capacity of these compounds. Furthermore, analysis of the mRNA expression levels of a set of 25 carefully selected genes potentially involved in modulation of T cell polarization revealed that the mRNA expression of notch ligand delta-4 and transcription factor c-fos are differentially regulated and show a strong correlation with Th1 and Th2 polarization, respectively.
Conclusion: This study shows that combined TLR2 and TLR4 activation in the context of different antigen sources can induce very distinct molecular profiles in DCs and suggests that the Th1/Th2 polarizing capacity of compounds can be predicted with the molecular signature they induce in DCs.
Figures
Similar articles
-
Cutting edge: different Toll-like receptor agonists instruct dendritic cells to induce distinct Th responses via differential modulation of extracellular signal-regulated kinase-mitogen-activated protein kinase and c-Fos.J Immunol. 2003 Nov 15;171(10):4984-9. doi: 10.4049/jimmunol.171.10.4984. J Immunol. 2003. PMID: 14607893
-
Selective induction of the Notch ligand Jagged-1 in macrophages by soluble egg antigen from Schistosoma mansoni involves ERK signalling.Immunology. 2009 Jul;127(3):326-37. doi: 10.1111/j.1365-2567.2008.02979.x. Epub 2008 Nov 14. Immunology. 2009. PMID: 19019093 Free PMC article.
-
Schistosoma mansoni egg antigen-mediated modulation of Toll-like receptor (TLR)-induced activation occurs independently of TLR2, TLR4, and MyD88.Infect Immun. 2008 Dec;76(12):5754-9. doi: 10.1128/IAI.00497-08. Epub 2008 Sep 29. Infect Immun. 2008. PMID: 18824534 Free PMC article.
-
Differential role of MAPK signaling in human dendritic cell maturation and Th1/Th2 engagement.J Dermatol Sci. 2006 Apr;42(1):1-11. doi: 10.1016/j.jdermsci.2005.11.004. Epub 2005 Dec 13. J Dermatol Sci. 2006. PMID: 16352421 Review.
-
A double edged sword: Schistosoma mansoni Sm29 regulates both Th1 and Th2 responses in inflammatory mucosal diseases.Mucosal Immunol. 2016 Nov;9(6):1366-1371. doi: 10.1038/mi.2016.69. Epub 2016 Aug 24. Mucosal Immunol. 2016. PMID: 27554296 Review. No abstract available.
Cited by
-
Salmonella Typhi OmpS1 and OmpS2 porins are potent protective immunogens with adjuvant properties.Immunology. 2013 Aug;139(4):459-71. doi: 10.1111/imm.12093. Immunology. 2013. PMID: 23432484 Free PMC article.
-
Pregnane X Receptor Regulates Pathogen-Induced Inflammation and Host Defense against an Intracellular Bacterial Infection through Toll-like Receptor 4.Sci Rep. 2016 Aug 23;6:31936. doi: 10.1038/srep31936. Sci Rep. 2016. PMID: 27550658 Free PMC article.
-
The effects of Ostertagia occidentalis somatic antigens on ovine TLR2 and TLR4 expression.Iran J Parasitol. 2015 Jul-Sep;10(3):498-504. Iran J Parasitol. 2015. PMID: 26622306 Free PMC article.
-
Revolutionizing Treatment Strategies for Autoimmune and Inflammatory Disorders: The Impact of Dipeptidyl-Peptidase 4 Inhibitors.J Inflamm Res. 2024 Mar 23;17:1897-1917. doi: 10.2147/JIR.S442106. eCollection 2024. J Inflamm Res. 2024. PMID: 38544813 Free PMC article. Review.
-
TLR2 mediates immunity to experimental cysticercosis.Int J Biol Sci. 2011;7(9):1323-33. doi: 10.7150/ijbs.7.1323. Epub 2011 Oct 25. Int J Biol Sci. 2011. PMID: 22110384 Free PMC article.
References
-
- de Jong EC, Vieira PL, Kalinski P, Schuitemaker JH, Tanaka Y, Wierenga EA, et al. Microbial compounds selectively induce Th1 cell-promoting or Th2 cell-promoting dendritic cells in vitro with diverse th cell-polarizing signals. J Immunol. 2002;168:1704–1709. - PubMed
Publication types
MeSH terms
Substances
LinkOut - more resources
Full Text Sources
Other Literature Sources
Molecular Biology Databases
Miscellaneous
