. 2009 Feb 9;184(3):373-81.
doi: 10.1083/jcb.200808130. Epub 2009 Feb 3.

Intrakinetochore stretch is associated with changes in kinetochore phosphorylation and spindle assembly checkpoint activity

Affiliations

Intrakinetochore stretch is associated with changes in kinetochore phosphorylation and spindle assembly checkpoint activity

Thomas J Maresca et al. J Cell Biol. .

Abstract

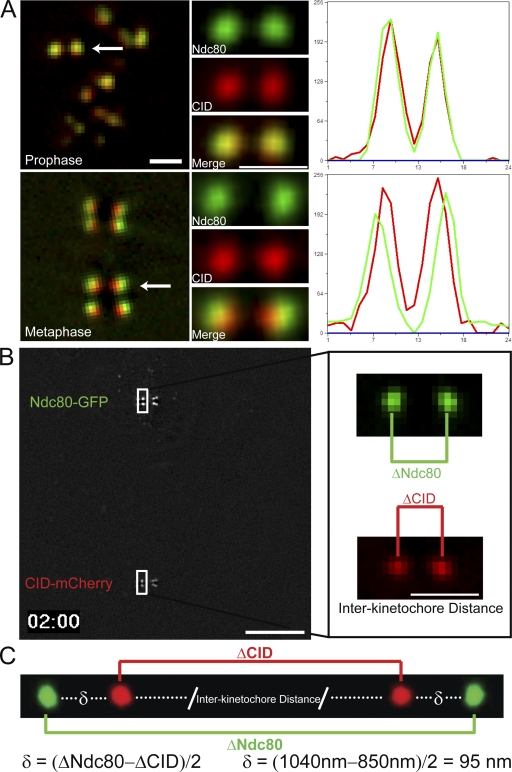
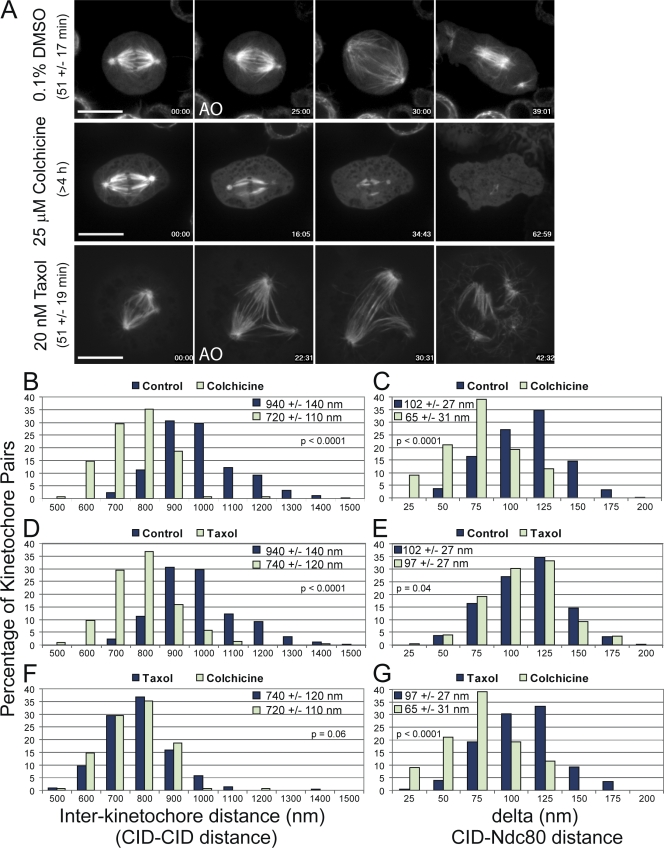
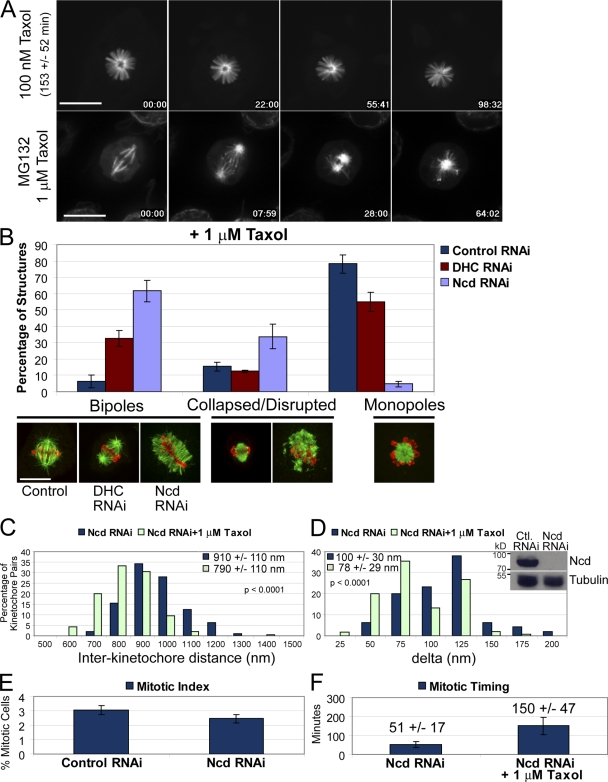
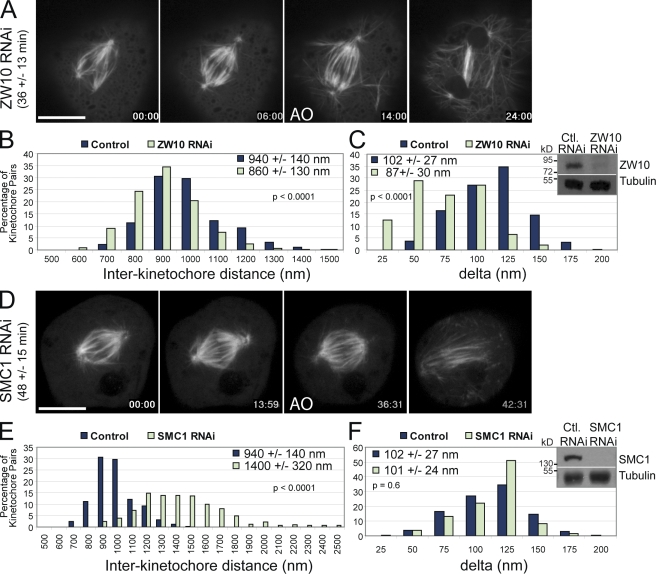
Cells have evolved a signaling pathway called the spindle assembly checkpoint (SAC) to increase the fidelity of chromosome segregation by generating a "wait anaphase" signal until all chromosomes are properly aligned within the mitotic spindle. It has been proposed that tension generated by the stretch of the centromeric chromatin of bioriented chromosomes stabilizes kinetochore microtubule attachments and turns off SAC activity. Although biorientation clearly causes stretching of the centromeric chromatin, it is unclear whether the kinetochore is also stretched. To test whether intrakinetochore stretch occurs and is involved in SAC regulation, we developed a Drosophila melanogaster S2 cell line expressing centromere identifier-mCherry and Ndc80-green fluorescent protein to mark the inner and outer kinetochore domains, respectively. We observed stretching within kinetochores of bioriented chromosomes by monitoring both inter- and intrakinetochore distances in live cell assays. This intrakinetochore stretch is largely independent of a 30-fold variation in centromere stretch. Furthermore, loss of intrakinetochore stretch is associated with enhancement of 3F3/2 phosphorylation and SAC activation.


Figures

Figure 1.
Figure 1.
K-Tensor Drosophila S2 cells exhibit detectable changes in the distance between the inner and outer layers of the kinetochore. (A) Representative micrographs of prophase and metaphase K-Tensor cells expressing Ndc80-GFP (green) and CID-mCherry (red). Ndc80, CID, and merged images are shown for the highlighted kinetochore pairs (white arrows). Line scans for each of the kinetochore pairs are shown to the right of each pair, with the red line indicating CID-mCherry intensity and the green line reflecting Ndc80-GFP intensity. (B) A single frame from a dual-view imaged K-Tensor cell (Video 1, available at http://www.jcb.org/cgi/content/full/jcb.200808130/DC1) showing simultaneous imaging of Ndc80-GFP and CID-mCherry. The inset shows enlarged images of the Ndc80 (green) and CID (red) signals for the highlighted kinetochore pair (white boxes). The distances between the two brightest pixels for each pair are represented by ΔNdc80 and ΔCID. (C) To calculate delta (δ), which is the distance between Ndc80-GFP and CID-mCherry, ΔCID is subtracted from ΔNdc80 and divided by two. Bars: (A and B, inset) 1 µm; (B) 10 µm.
Figure 2.
Figure 2.
Microtubule poisons differentially affect interkinetochore distance and delta. (A) Selected frames from time-lapse imaging of GFP-tubulin–expressing S2 cells after treatment with DMSO, 25 µM colchicine, or 20 nM taxol. DMSO control cells progress through mitosis (as defined by chromosome condensation to anaphase onset [AO]) in 51 ± 17 min (n = 124 cells). Spindle microtubules completely depolymerize within 1 h after the addition of 25 µM colchicine, which causes cells to delay in mitosis for at least 4 h (n = 40 cells). Cells treated with 20 nM taxol progress through mitosis with the same kinetics as control cells (51 ± 19 min; n = 121 cells). (B–G) The distributions of interkinetochore distances (left) and delta (right) values are shown for all treatments. (B and C) Colchicine treatment causes reduction of both interkinetochore distance and delta, defining the rest lengths for each parameter (n = 156 kinetochore pairs). (D and E) Taxol treatment (n = 228 kinetochore pairs) causes a reduction in the interkinetochore distance; however, delta is not dramatically reduced relative to controls (n = 346 kinetochore pairs). (F and G) Comparing taxol and colchicine treatments highlights the fact that 20 nM taxol causes the interkinetochore distance to approach rest length without dramatically reducing delta. The mean values ± standard deviations and the two-tailed p-values for all conditions are shown in each graph. Bars, 10 µm.
Figure 3.
Figure 3.
Treatment with 1 µM taxol reduces delta and activates the SAC. (A) Selected frames from time-lapse imaging of a preformed taxol monopole (top) and an MG132-treated bipolar spindle collapsing into a monopole after the addition of 1 µM taxol (bottom). Taxol monopoles delay in mitosis for 153 ± 52 min. (B) Taxol-induced spindle collapse is mediated by minus end–directed motor activity. The graph shows the percentage of each indicated structure with representative images after treatment with 1 µM taxol for 1 h. (C and D) Treatment of Ncd RNAi structures with 1 µM taxol (n = 240 kinetochore pairs) causes a reduction in both the interkinetochore distance and delta relative to Ncd RNAi alone (n = 95 kinetochore pairs). Ncd is undetectable by Western blotting (inset) after dsRNA treatment (96 h). (E) Ncd RNAi does not cause an increase in the number of mitotic cells in a cycling population. (F) Ncd RNAi cells divide with normal kinetics (51 ± 17 min; n = 100 cells), but addition of 1 µM taxol delays them in mitosis for 150 ± 47 min (n = 77 cells), indicating that the SAC is activated. The mean values ± standard deviations and the two-tailed p-values are shown in each graph. Error bars represent the standard deviations. Bars, 10 µm.
Figure 4.
Figure 4.
Interkinetochore distance and delta can be experimentally uncoupled. (A) Selected frames from time-lapse imaging of GFP-tubulin cells after ZW10 RNAi treatment. Cells progress through mitosis in 36 ± 13 min (n = 141 cells) in the absence of ZW10, which is faster than control cells (51 ± 17 min). (B and C) Reduced levels of ZW10 cause interkinetochore distances and delta (n = 777 kinetochore pairs) to be reduced relative to controls. Western blot analysis (inset) reveals efficient knockdown of ZW10 by RNAi (96 h). (D) Frames from time-lapse imaging of GFP-tubulin cells after SMC1 RNAi. Similar to control cells (51 ± 17 min), SMC1 dsRNA–treated cells progress through mitosis in 48 ± 15 min (n = 222 cells). (E and F) SMC1 RNAi increases the interkinetochore distance without affecting delta (n = 451 kinetochore pairs). SMC1 is nearly undetectable by Western blotting (inset) after dsRNA treatments (96 h). The mean values ± standard deviations and the two-tailed p-values for all conditions are shown in each graph. AO, anaphase onset. Bars, 10 µm.
Figure 5.
Figure 5.
Generation of the tension-sensitive phosphoepitope 3F3/2 correlates with changes in delta. (A) Representative micrographs from each of the indicated conditions. In the merged images, DNA is blue, CID is red, and 3F3/2 is green. (B) The ratio of fluorescent intensities for 3F3/2-CID signals versus centromere stretch, intrakinetochore stretch, and mitotic progression is shown for each experimental condition. The 3F3/2 levels (n = 373 pairs from seven experiments), centromere stretch, kinetochore stretch, and mitotic progression for control + DMSO cells were each assigned a value of 100%, and all other experimental conditions were normalized accordingly. Colchicine treatment results in a 2.4-fold increase in 3F3/2 levels (n = 522 kinetochore pairs from nine experiments) and a reduction of kinetochore and centromere stretches to their minima (rest lengths) as well as a mitotic delay. 20 nM taxol does not cause a mitotic delay or elevated levels of 3F3/2 (n = 102 pairs from three experiments) despite an ∼90% reduction in centromere stretch. Ncd RNAi + DMSO (3F3/2 measurements: n = 154 pairs from three experiments) behave similar to control cells; however, addition of 1 µM taxol to Ncd RNAi cells causes a 2.4-fold increase in 3F3/2 levels (n = 161 pairs from three experiments), a 65% reduction in centromere and kinetochore stretches, and a mitotic delay. ZW10 RNAi cells (n = 189 pairs from three experiments) have 1.8-fold higher levels of 3F3/2 and an ∼40% reduction in both centromere stretch and kinetochore stretch but progress through mitosis faster than control cells. SMC1 RNAi cells have levels of 3F3/2 staining similar to controls (n = 144 pairs from three experiments), hyperstretched centromeres, normal kinetochore stretch, and normal mitotic progression. The error bars represent the standard deviations. Bar, 10 µm.

Comment in

References

    1. Basto R., Gomes R., Karess R.E. 2000. Rough deal and Zw10 are required for the metaphase checkpoint in Drosophila.Nat. Cell Biol. 2:939–943 - PubMed
    1. Biggins S., Murray A.W. 2001. The budding yeast protein kinase Ipl1/Aurora allows the absence of tension to activate the spindle checkpoint.Genes Dev. 15:3118–3129 - PMC - PubMed
    1. Buffin E., Lefebvre C., Huang J., Gagou M.E., Karess R.E. 2005. Recruitment of Mad2 to the kinetochore requires the Rod/Zw10 complex.Curr. Biol. 15:856–861 - PubMed
    1. Dong Y., Vanden Beldt K.J., Meng X., Khodjakov A., McEwen B.F. 2007. The outer plate in vertebrate kinetochores is a flexible network with multiple microtubule interactions.Nat. Cell Biol. 9:516–522 - PMC - PubMed
    1. Famulski J.K., Chan G.K. 2007. Aurora B kinase-dependent recruitment of hZW10 and hROD to tensionless kinetochores.Curr. Biol. 17:2143–2149 - PubMed

Publication types

MeSH terms