. 2009 Apr 3;284(14):9083-92.
doi: 10.1074/jbc.M806989200. Epub 2009 Feb 4.

Hyaluronan orchestrates transforming growth factor-beta1-dependent maintenance of myofibroblast phenotype

Affiliations

Hyaluronan orchestrates transforming growth factor-beta1-dependent maintenance of myofibroblast phenotype

Jason Webber et al. J Biol Chem. .

Abstract

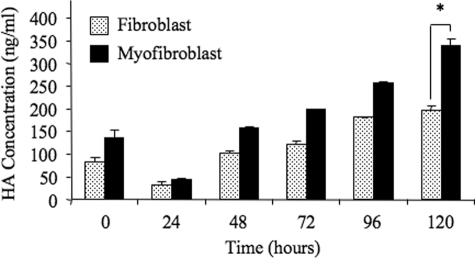
The differentiation of resident fibroblasts to myofibroblasts is central to wound healing. In the context of organ fibrosis, however, persistence of these myofibroblasts is associated with progressive disease. This study examines mechanisms controlling the maintenance of the myofibroblast phenotype. Myofibroblasts were induced by adding transforming growth factor-beta1 (TGF-beta1) (10 ng/ml) to fibroblasts for 72 h. The phenotype was maintained for up to 120 h following removal of TGF-beta1. Western blot for pSmad2 and -3 demonstrated persistent phosphorylation despite removal of exogenous TGF-beta1. This persistence was because of autocrine synthesis of TGF-beta1, which was inhibited by both anti-TGF-beta1 antibody and the ALK5 inhibitor SB431542. Persistence of phenotype was also associated with increased hyaluronan (HA) generation, synthesis of the hyaladherin TSG6, and HA pericellular coat formation. These were all inhibited by TGF-beta receptor blockade. To further investigate the importance of HA synthesis, 4-methylumbelliferone was used to deplete the cytoplasmic pool of UDP-glucuronic acid, essential for HA chain elongation. This prevented formation of the pericellular HA matrix and decreased expression of alpha-SMA. 4-Methylumbelliferone had no effect, however, on Smad2 and -3 phosphorylation. Similarly inhibition of HAS2 by short interfering RNA prevented phenotypic activation without altering TGF-beta1-dependent Smad phosphorylation, thus suggesting that HA-dependent regulation of cell phenotype was independent of Smad activation. These data suggest that myofibroblasts in areas of fibrosis maintain their own phenotype through autocrine TGF-beta1 action and that extracellular HA matrices are an essential mediator of this. We propose a model in which the formation of the pericellular HA matrix regulates the outcome of Smad-dependent autocrine TGF-beta1-activated signaling, and therefore persistence of the myofibroblast phenotype.


Figures

FIGURE 1.
FIGURE 1.
Induction and stability of the myofibroblast phenotype. A, expression of α-SMA mRNA following TGF-β1 stimulation. Fibroblasts were grown until sub-confluent prior to growth arrest. Medium was aspirated and replaced either with fresh serum-free medium (Control) or serum-free medium containing 10 ng/ml TGF-β1. mRNA was extracted and α-SMA expression quantified by Q-PCR. The results are expressed as the mean ± S.E. of at least four independent experiments. Statistical analysis was performed using the paired Student's t test, and statistical significance was taken as p < 0.05. ***, p < 0.001. B, expression of α-SMA mRNA in the myofibroblast. Fibroblasts were either differentiated (10 ng/ml TGF-β1) to the myofibroblast phenotype or undifferentiated (Control) in serum-free conditions for 72 h. Medium was aspirated and replaced with fresh serum-free medium for times up to 120 h, and mRNA was extracted as prior to quantitation of α-SMA expression by Q-PCR. Ribosomal RNA expression was used as an endogenous control, and gene expression was assayed relative to control samples. The results are expressed as the mean ± S.E. of at least four independent experiments. Statistical analysis was performed using the paired Student's t test, and statistical significance was taken as p < 0.05. ***, p < 0.001. C–F, expression of α-SMA protein in the myofibroblast. Confluent fibroblasts at time 0 h (C) or after exposure to serum-free medium for 72 h (E), and myofibroblasts at 0 h (D) and 72-h post-removal of TGF-β1(F) were fixed. Cells were subsequently immunostained for α-SMA. Results are representative of four individual experiments.
FIGURE 2.
FIGURE 2.
Smad phosphorylation and TGF-β1 autoinduction in the myofibroblast. Growth-arrested fibroblasts (F) were differentiated to the myofibroblast (M) phenotype by the addition of TGF-β1 (10 ng/ml) for 72 h. Myofibroblast Smad activation was contrasted to unstimulated growth-arrested fibroblasts followed by the addition of serum-free medium for a further 120 h. A, phosphorylation of Smad3. Cell protein was extracted, and SDS-PAGE and Western blotting for phosphorylated Smad3 (P-Smad3) and total Smad3 (T-Smad3) were performed as described under “Experimental Procedures.” Data are representative of four independent experiments. B, expression of TGF-β1 mRNA. mRNA was extracted as described and TGF-β1 expression quantified by Q-PCR. Ribosomal RNA expression was used as an endogenous control, and gene expression was assayed relative to control samples. The results are expressed as the mean ± S.E. of four independent experiments. Statistical analysis was performed using the paired Student's t test, and statistical significance was taken as p < 0.05. *, p < 0.05. C, quantitation of TGF-β1. In parallel experiments, conditioned medium was collected for quantitation of TGF-β1 by ELISA. Data represent mean ± S.E. of four independent experiments. Statistical analysis was performed using the paired Student's t test, and statistical significance was taken as p < 0.05. ***, p < 0.001.
FIGURE 3.
FIGURE 3.
Autocrine TGF-β1 signaling in the myofibroblast. A, generation of TGF-β1. Serum-free medium was added for 72 h to myofibroblasts or serum-free medium alone to fibroblasts, and conditioned medium was collected and stored at –80 °C. TGF-β1 bioassay of the conditioned medium was performed by transfection of HK-2 cells with a Smad-responsive promoter (SBE)4-Lux, before addition of myofibroblast or fibroblast condition medium. Serum-free medium (Control) and 1 ng/ml TGF-β1(TGF-β1) were used as negative and positive controls, respectively. After 6 h of incubation at 37 °C, luciferase activity was measured as described. Data represent mean ± S.E. of four independent experiments. Statistical analysis was performed using the one-way ANOVA test (p = 0.0162) followed by Tukey's HSD post-hoc test, and statistical significance was taken as p < 0.05. *, p < 0.05. B, TGF-β receptor/ALK5 expression. Fibroblasts were cultured in serum-free medium, and myofibroblasts were cultured in serum-free medium in following removal of TGF-β1 for 72 h. Cell protein was extracted prior to SDS-PAGE and Western blot analysis for the type I TGF-β receptor, ALK5. Results of three independent experiments are shown. C and D, phosphorylation of Smad2 and Smad3. Serum-free medium alone, serum-free medium together with the ALK5-specific inhibitor (10 μm SB431542), or serum-free medium together with 0.1% DMSO were added to myofibroblasts of unstimulated fibroblast for up to 72 h. At the indicated time points cell protein was extracted prior to SDS-PAGE and Western blot analysis for phosphorylated Smad2 and -3. Densitometric analysis of myofibroblast protein bands representing phosphorylated Smad2 and -3 were performed using glyceraldehyde-3-phosphate dehydrogenase (GAPDH) as a loading control (D). Data represent mean ± S.E. of three independent experiments. Statistical analysis was performed using the one-way ANOVA test (P-Smad2, p = 0.00286; P-Smad3, p < 0.001) followed by Tukey's HSD post-hoc test, and statistical significance was taken as p < 0.05. **, p < 0.01; ***, p < 0.001; NS = not significant.
FIGURE 4.
FIGURE 4.
Autocrine TGF-β1 signaling is essential for maintenance of phenotype. A, α-SMA mRNA expression. Total mRNA was extracted from growth-arrested fibroblasts or myofibroblast to which serum-free medium alone (Control) together with 10 μm SB431542 or 0.1% DMSO were added for 72 h. Subsequently, α-SMA expression was quantified by Q-PCR. Ribosomal RNA expression was used as an endogenous control, and gene expression was assayed relative to control samples. The results are expressed as the mean ± S.E. of four independent experiments. Statistical analysis was performed using the one-way ANOVA test (p = 0.0158) followed by Tukey's HSD post-hoc test, and statistical significance was taken as p < 0.05. *, p < 0.05; NS, not significant. B–D, α-SMA protein expression. In parallel experiments, growth-arrested myofibroblasts to which serum-free medium alone (B), serum-free medium together with 10 μm SB431542 (C), or serum-free medium and 0.1% DMSO (D) were added for 72 h were fixed and immunostained for α-SMA. Results are representative of four independent experiments.
FIGURE 5.
FIGURE 5.
Role of TSG-6 and the pericellular HA coat. A, expression of TSG-6 in fibroblasts and myofibroblasts. mRNA was extracted from either unstimulated growth-arrested fibroblasts or TGF-β1-induced myofibroblasts following incubation with serum-free medium for up to 120 h as indicated, and TSG-6 expression was quantified by Q-PCR. Ribosomal RNA expression was used as an endogenous control, and gene expression was assayed relative to control samples. The results are expressed as the mean ± S.E. of four independent experiments. Statistical analysis was performed using the paired Student's t test, and statistical significance was taken as p < 0.05. **, p < 0.01. B, inhibition of TGF-β signaling abrogates TSG-6 expression. Total mRNA was extracted from growth-arrested fibroblasts or myofibroblast to which serum-free medium alone (control) together with 10 μm SB431542 or 0.1% DMSO were added for 72 h. Subsequently, TSG-6 expression was quantified by Q-PCR. Ribosomal RNA expression was used as an endogenous control, and gene expression was assayed relative to control samples. The results are expressed as the mean ± S.E. of four independent experiments. Statistical analysis was performed using the one-way ANOVA test (p = 0.000284) followed by Tukey's HSD post-hoc test, and statistical significance was taken as p < 0.05. *, p < 0.05; NS = not significant. C–H, inhibition of TGF-β1 signaling prevents HA coat assembly. Serum-free medium alone (C and E) or serum-free medium containing 10 ng/ml TGF-β1(D, F, G, and H) was added to growth-arrested fibroblasts for 72 h. At time 0 h post-removal of TGF-β1(C and D) medium was aspirated, and formalized horse erythrocytes were added to visualize the HA pericellular coat. Either serum-free medium alone (E) or TGF-β1 alone (F) or TGF-β1 together with either 10 μm SB431542 (G) or 200 μg/ml bovine testicular hyaluronidase (H) were added for 72 h. Formalized horse erythrocytes were then added to visualize the HA pericellular coat. Zones of exclusion were visualized using Zeiss Axiovert 135 inverted microscope. The cell bodies are denoted by black arrows and the pericellular coats denoted by white arrowheads. The results are representative of three independent experiments. Original magnification was ×200.
FIGURE 6.
FIGURE 6.
Myofibroblasts produce HA in the absence of endogenous TGF-β1. Serum-free medium was added to growth-arrested fibroblasts or myofibroblasts for times up to 120 h. Subsequently, conditioned medium was collected and HA production quantified by ELISA. Results are expressed as the mean ± S.E. of three independent experiments. Statistical analysis was performed using the paired Student's t test, and statistical significance was taken as p < 0.05. *, p < 0.05.
FIGURE 7.
FIGURE 7.
Inhibition of HA synthesis causes loss of HA coat and loss of myofibroblast phenotype. Loss of HA coat is shown (A–E). Pericellular HA matrices were visualized by exclusion of formalized horse erythrocytes in fibroblasts (A) and myofibroblasts (B) at time 0 h. Additionally, following growth arrest serum-free medium alone was added to fibroblasts (C) and myofibroblasts (D), or serum-free medium containing 0.5 mm 4MU in serum-free medium was added to myofibroblasts (E) for a further 72 h. Zones of exclusion were visualized using Zeiss Axiovert 135 inverted microscope. The cell bodies are denoted by black arrows and the pericellular coats denoted by white arrowheads. The results are representative of three independent experiments. Original magnification was ×200. F, inhibition of HA synthesis and α-SMA expression. α-SMA expression was examined in growth-arrested fibroblasts, myofibroblasts, or myofibroblast to which either 0.5 mm 4MU in serum-free medium or 0.1% DMSO in serum-free medium was added. mRNA was extracted as described and α-SMA expression quantified by Q-PCR. Ribosomal RNA expression was used as an endogenous control, and gene expression was assayed relative to control samples. The results are expressed as the mean ± S.E. of four independent experiments. Statistical analysis was performed using the one-way ANOVA test (p = 0.00796) followed by Tukey's HSD post-hoc test, and statistical significance was taken as p < 0.05. *, p < 0.05. NS, not significant.
FIGURE 8.
FIGURE 8.
Inhibition of HA chain elongation does not affect autocrine TGF-β1-dependent Smad-related signaling. Serum-free medium alone, 0.5 mm 4MU in serum-free medium, or 0.1% DMSO in serum-free medium was added to growth-arrested fibroblasts and myofibroblasts for 72 h. Cell protein was extracted as described, and SDS-PAGE and Western blotting for phosphorylated Smad2 and -3 were performed (A). Densitometric analysis of myofibroblast protein bands representing phosphorylated Smad2 and -3 were performed using glyceraldehyde-3-phosphate dehydrogenase (GAPDH) as a loading control (B). Data represent mean ± S.E. of three independent experiments. Statistical analysis was performed using the one-way ANOVA test (P-Smad2, p < 0.001; P-Smad3, p < 0.001) followed by Tukey's HSD post-hoc test, and statistical significance was taken as p < 0.05. NS, not significant.
FIGURE 9.
FIGURE 9.
Inhibition of HA synthesis does not affect autocrine TGF-β1-dependent Smad-related signaling. A and B, effect of HAS2 siRNA on phenotype. Total mRNA was extracted from fibroblasts and myofibroblasts following transfection with HAS2 or negative control (scrambled) siRNA. Expression of HAS2 (A) and α-SMA (B) were quantified by Q-PCR. Ribosomal RNA expression was used as an endogenous control, and gene expression was assayed relative to control samples. The results are expressed as the mean ± S.E. of four independent experiments. Statistical analysis was performed using the one-way ANOVA test (p < 0.001) followed by Tukey's HSD post-hoc test, and statistical significance was taken as p < 0.05. *, p < 0.05. C and D, effect of HAS2 siRNA on Smad-related TGF-β1 signaling. In parallel experiments, cell protein was extracted from fibroblasts and myofibroblasts following transfection with HAS2 siRNA or negative control (scrambled) siRNA. SDS-PAGE and Western blotting for phosphorylated Smad2 and -3 were performed (C). Densitometric analysis of myofibroblast protein bands representing phosphorylated Smad2 and -3 were performed using glyceraldehyde-3-phosphate dehydrogenase (GAPDH) as a loading control (D). Data represent mean ± S.E. of three independent experiments. Statistical analysis was performed using the one-way ANOVA test (P-Smad2, p < 0.001; P-Smad3, p < 0.001) followed by Tukey's HSD post-hoc test, and statistical significance was taken as p < 0.05. NS, not significant.

Similar articles

Cited by

References

    1. Sappino, A. P., Schürch, W., and Gabbiani, G. (1990) Lab. Investig. 63 144–161 - PubMed
    1. Gabbiani, G. (2003) J. Pathol. 200 500–503 - PubMed
    1. Desmouliere, A., and Gabbiani, G. (1996) in The Molecular and Cellular Biology of Wound Repair (Clark, R. A. F., ed) 2nd Ed., pp. 391–423, Plenum Publishing Corp., New York
    1. Essawy, M., Soylemezoglu, O., Muchaneta-Kubara, E. C., Shortland, J., Brown, C. B., and El Nahas, A. M. (1997) Nephrol. Dial. Transplant. 12 43–50 - PubMed
    1. Goumenos, D. S., Brown, C. B., Shortland, J., and El Nahas, A. M. (1994) Nephrol. Dial. Transplant. 9 1418–1425 - PubMed

Publication types

LinkOut - more resources