

Does cartilage volume or thickness distinguish knees with and without mild radiographic osteoarthritis? The Framingham Study
- PMID: 19193659
- PMCID: PMC2794983
- DOI: 10.1136/ard.2008.099200
Does cartilage volume or thickness distinguish knees with and without mild radiographic osteoarthritis? The Framingham Study
Abstract
Objectives: To examine whether the quantity of cartilage or semiquantitative scores actually differ in knees with mild radiographic osteoarthritis compared with knees without osteoarthritis.
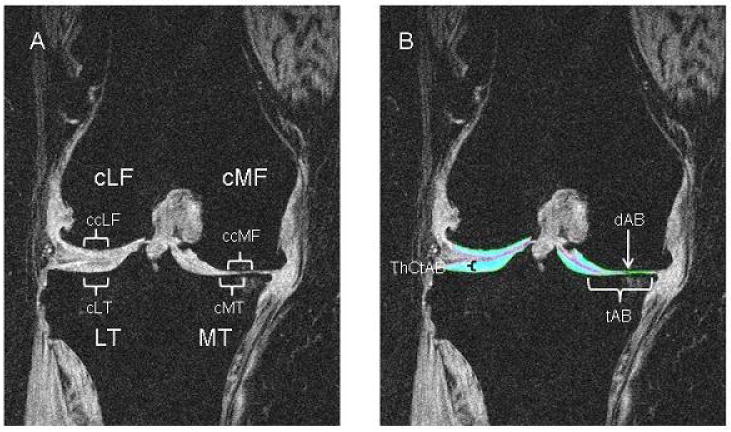
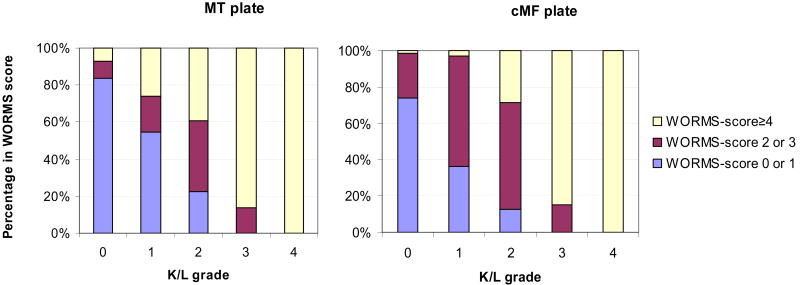
Methods: Framingham Osteoarthritis Study participants had knee tibiofemoral magnetic resonance imaging-based measurements of cartilage. Using three-dimensional FLASH-water excitation sequences, cartilage volume, thickness and subregional cartilage thickness were measured and cartilage scored semiquantitatively (using the whole-organ magnetic resonance imaging score; WORMS). Using weight-bearing radiographs, mild osteoarthritis was defined as Kellgren/Lawrence (K/L) grade 2 and non-osteoarthritis as K/L grade 0. Differences between osteoarthritis and non-osteoarthritis knees in median cartilage measurements were tested using the Wilcoxon rank sum test.
Results: Among 948 participants (one knee each), neither cartilage volume nor regional thickness were different in mild versus non-osteoarthritis knees. In mild osteoarthritis, cartilage erosions in focal areas were missed when cartilage was quantified over large regions such as the medial tibia. For some but not all subregions of cartilage, especially among men, cartilage thickness was lower (p<0.05) in mild osteoarthritis than non-osteoarthritis knees. Because semiquantitative scores captured focal erosions, median WORMS scores were higher in mild osteoarthritis than non-osteoarthritis (all p<0.05). In moderate/severe osteoarthritis (K/L grades 3 or 4), osteoarthritis knees had much lower cartilage thickness and higher WORMS scores than knees without osteoarthritis.
Conclusions: In mild osteoarthritis, the focal loss of cartilage is missed by quantitative measures of cartilage volume or thickness over broad areas. Regional cartilage volume and thickness (eg, medial tibia) are not different in mild osteoarthritis versus non-osteoarthritis. Subregional thickness may be decreased in mild osteoarthritis. Semiquantitative scoring that assesses focal cartilage damage differentiates mild osteoarthritis from non-osteoarthritis.
Conflict of interest statement
Ali Guermazi is president of Boston Imaging Core Lab, LLC (BICL), a company providing radiological image assessment services. He is shareholder of Synarc, Inc.
Frank Roemer is shareholder of BICL.
Other authors declare no conflict of interest.
Figures
References
-
- Altman RD, Fries JF, Bloch DA, Carstens J, Cooke TD, Genant H, et al. Radiographic assessment of progression in osteoarthritis. Arthritis Rheum. 1987;30:1214–25. - PubMed
-
- Burgkart R, Glaser C, Hyhlik-Durr A, Englmeier KH, Reiser M, Eckstein F. Magnetic resonance imaging-based assessment of cartilage loss in severe osteoarthritis: accuracy, precision, and diagnostic value. Arthritis Rheum. 2001;44:2072–7. - PubMed
-
- Graichen H, von Eisenhart-Rothe R, Vogl T, Englmeier KH, Eckstein F. Quantitative assessment of cartilage status in osteoarthritis by quantitative magnetic resonance imaging: technical validation for use in analysis of cartilage volume and further morphologic parameters. Arthritis Rheum. 2004;50:811–6. - PubMed
-
- Eckstein F, Charles HC, Buck RJ, Kraus VB, Remmers AE, Hudelmaier M, et al. Accuracy and precision of quantitative assessment of cartilage morphology by magnetic resonance imaging at 3.0T. Arthritis Rheum. 2005;52:3132–6. - PubMed
-
- Eckstein F, Burstein D, Link TM. Quantitative MRI of cartilage and bone: degenerative changes in osteoarthritis. NMR Biomed. 2006;19:822–54. - PubMed
Publication types
MeSH terms
Grants and funding
LinkOut - more resources
Full Text Sources
