. 2009 Apr;296(4):F730-50.
doi: 10.1152/ajprenal.90564.2008. Epub 2009 Feb 4.

NHE8 is an intracellular cation/H+ exchanger in renal tubules of the yellow fever mosquito Aedes aegypti

Affiliations

NHE8 is an intracellular cation/H+ exchanger in renal tubules of the yellow fever mosquito Aedes aegypti

Peter M Piermarini et al. Am J Physiol Renal Physiol. 2009 Apr.

Abstract

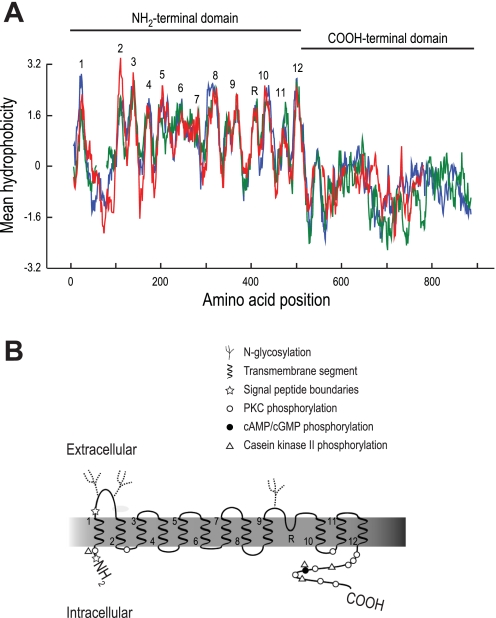
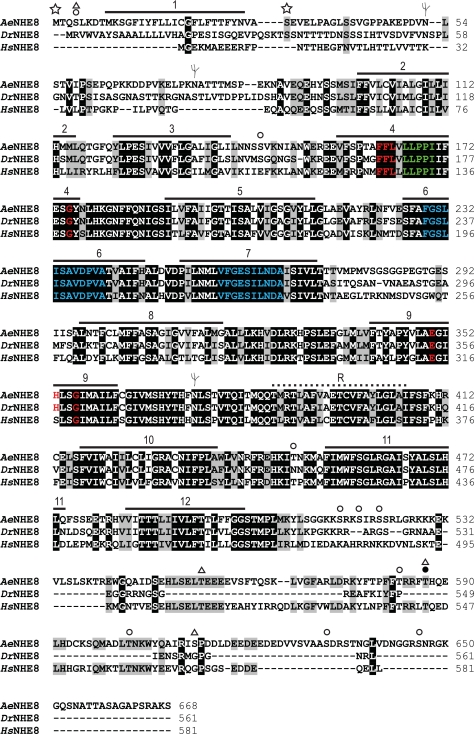
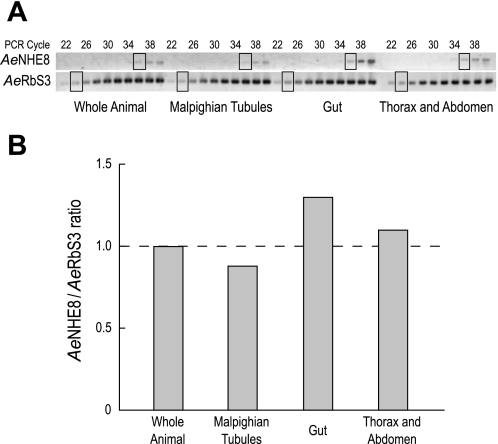
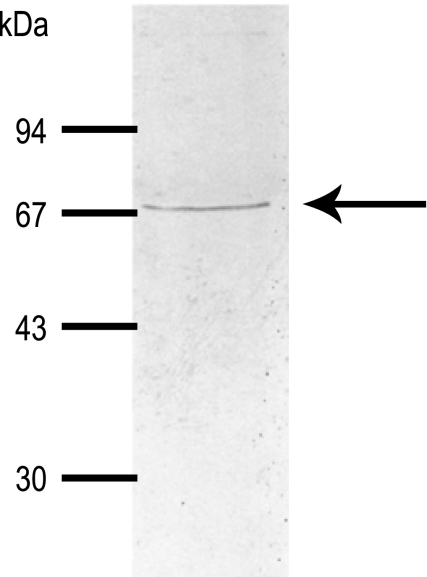
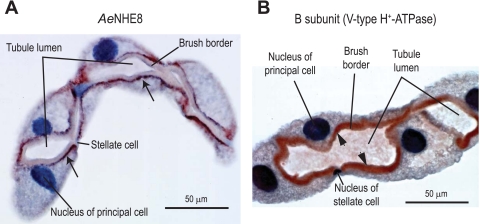
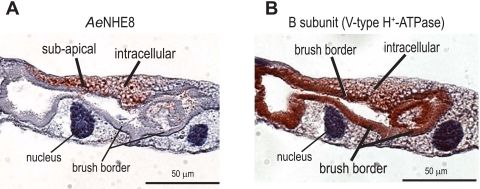
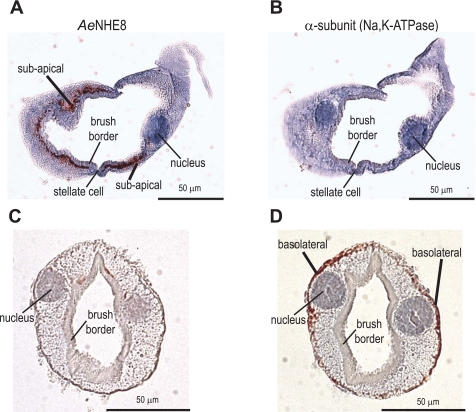
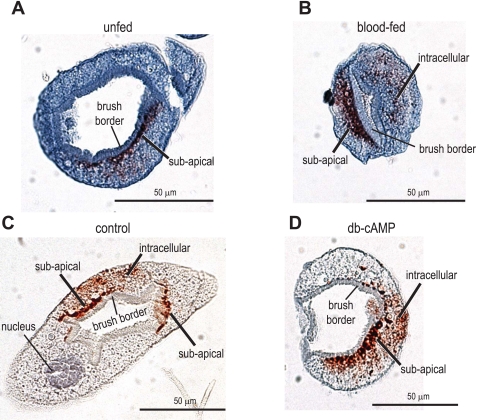
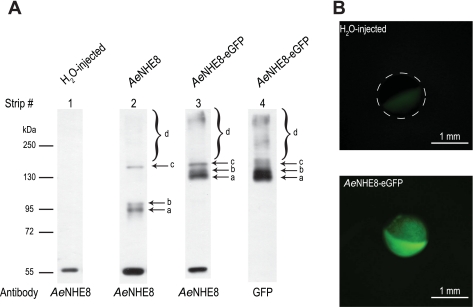
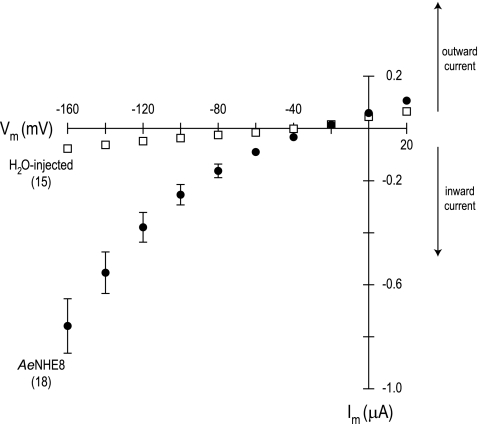
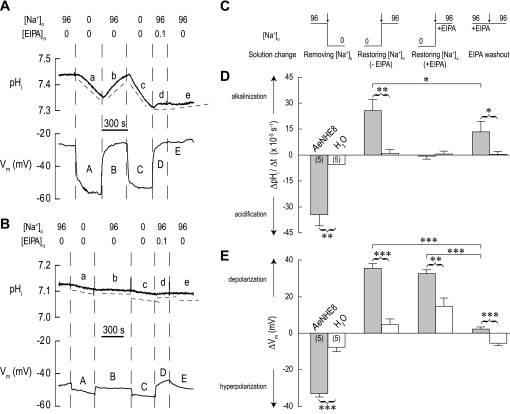
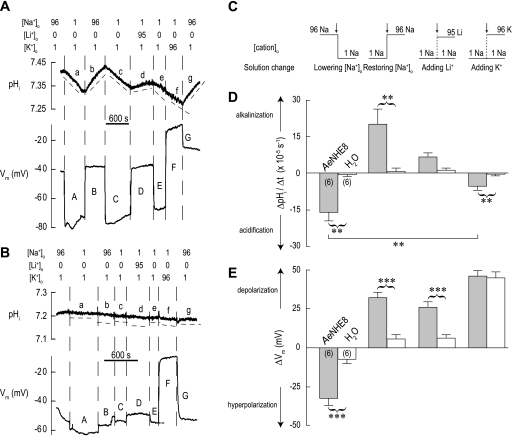
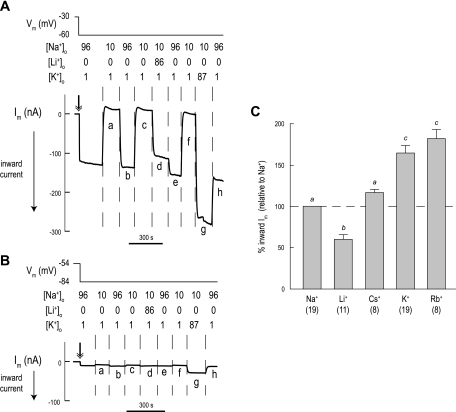
The goal of this study was to identify and characterize the hypothesized apical cation/H(+) exchanger responsible for K(+) and/or Na(+) secretion in the renal (Malpighian) tubules of the yellow fever mosquito Aedes aegypti. From Aedes Malpighian tubules, we cloned "AeNHE8," a full-length cDNA encoding an ortholog of mammalian Na(+)/H(+) exchanger 8 (NHE8). The expression of AeNHE8 transcripts is ubiquitous among mosquito tissues and is not enriched in Malpighian tubules. Western blots of Malpighian tubules suggest that AeNHE8 is expressed primarily as an intracellular protein, which was confirmed by immunohistochemical localizations in Malpighian tubules. AeNHE8 immunoreactivity is expressed in principal cells of the secretory, distal segments, where it localizes to a subapical compartment (e.g., vesicles or endosomes), but not in the apical brush border. Furthermore, feeding mosquitoes a blood meal or treating isolated tubules with dibutyryl-cAMP, both of which stimulate a natriuresis by Malpighian tubules, do not influence the intracellular localization of AeNHE8 in principal cells. When expressed heterologously in Xenopus laevis oocytes, AeNHE8 mediates EIPA-sensitive Na/H exchange, in which Li(+) partially and K(+) poorly replace Na(+). The expression of AeNHE8 in Xenopus oocytes is associated with the development of a conductive pathway that closely resembles the known endogenous nonselective cation conductances of Xenopus oocytes. In conclusion, AeNHE8 does not mediate cation/H(+) exchange in the apical membrane of Aedes Malpighian tubules; it is more likely involved with an intracellular function.


Figures

Fig. 1.
Fig. 1.
Hydropathic analysis and predicted topology of AeNHE8. A: aligned hydropathic plots of AeNHE8 (red), human NHE1 (blue), and human NHE3 (green) generated in the BioEdit Sequence Alignment Editor software, version 7 (30) using the Kyte-Doolittle algorithm (36) with a window size of 15. Breaks in the red and green lines represent gaps introduced by the sequence alignment. Numbers indicate predicted transmembrane segments, and R indicates a predicted reentrant loop. B: predicted topology map of AeNHE8 based on hydropathy plot in A. Transmembrane segments are numbered at their emerging ends. Putative posttranslational modifications and regulatory sites are also indicated (see text and Fig. 2 for details). The symbols are placed next to one another if they share a putative phosphorylation site.
Fig. 2.
Fig. 2.
Annotated sequence alignment. The amino acid sequence of AeNHE8, predicted by its cDNA (accession no. EU760347), is aligned with those of NHE8 from Drosophila melanogaster (DrNHE8; accession no. AAD32689) and Homo sapiens (HsNHE8; accession no. NP_056081) by the ClustalW algorithm (39). The residue shading was performed by BioEdit Sequence Alignment software, version 7 (30) with a threshold of 100%. Identical residues are shaded in black; similar residues are highlighted in gray. Numbered horizontal bars indicate the predicted transmembrane segments, and the dotted line indicates the reentrant loop, which are depicted in Fig. 1B. Red text indicates residues associated with sensitivity to amiloride and its analogs. Green text indicates the residues conserved among all NHEs. Blue text indicates the regions of high homology. See text for details. Symbols are as in Fig. 1B.
Fig. 3.
Fig. 3.
Relative mRNA expression of AeNHE8. A: images of RT-PCR products for AeNHE8 and ribosomal protein AeRbS3 separated by agarose gel electrophoresis. Every other PCR cycle is indicated, starting at cycle 22. The boxed areas represent those bands selected for relative expression analysis. B: ratios of AeNHE8 expression at cycle 36 to AeRbS3 expression at cycle 24. Dashed line indicates the threshold ratio for enriched or reduced expression relative to the whole animal.
Fig. 4.
Fig. 4.
Expression of AeNHE8 immunoreactivity in female Malpighian tubules. Western blotting on crude homogenates from isolated Malpighian tubules of adult Aedes females is shown. Arrow indicates the protein band displaying AeNHE8 immunoreactivity. Molecular mass markers (in kDa) are indicated.
Fig. 5.
Fig. 5.
Immunoperoxidase localizations of AeNHE8 and the B subunit of the V-type H+-ATPase in female Malpighian tubules. Representative localizations are shown of AeNHE8 (A) and the B subunit of the V-type H+-ATPase (B) in isolated Malpighian tubules of adult Aedes females. Red staining identified by the arrows in A and arrowheads in B represents labeling by the respective antibodies. Sections are counterstained with hematoxylin to stain nuclei and provide contrast.
Fig. 6.
Fig. 6.
Immunoreactivity for AeNHE8 and the V-type H+-ATPase in consecutive sections of female Malpighian tubules. Localizations are shown of AeNHE8 (A) and subunit B of the V-type H+-ATPase (B) in isolated Malpighian tubules of adult Aedes females. A and B: consecutive sections (4 μm apart) of the same Malpighian tubule. Red staining represents labeling by the respective antibodies. Sections are counterstained with hematoxylin to stain nuclei and provide contrast. Note that AeNHE8 is not present in every principal cell.
Fig. 7.
Fig. 7.
Immunoreactivity for AeNHE8 and the Na-K-ATPase in consecutive sections of female Malpighian tubules. Localizations are shown of AeNHE8 (A and C) and the α-subunit of the Na-K-ATPase (B and D) in isolated Malpighian tubules of adult Aedes females. Consecutive sections (4 μm apart) of 1 tubule are shown, respectively, in A, B, and C, D. Red staining represents labeling by the respective antibodies. Sections are counterstained with hematoxylin to stain nuclei and provide contrast. Only principal cells of the proximal segments of Aedes Malpighian tubules express basolateral immunoreactivity for the Na-K-ATPase (55). Thus the AeNHE8-positive principal cells in A are from the distal Malpighian tubule, and the AeNHE8-negative principal cells in C are from the proximal Malpighian tubule.
Fig. 8.
Fig. 8.
Immunoreactivity for AeNHE8 in control and stimulated female Malpighian tubules. Representative localizations are shown of AeNHE8 in Malpighian tubules of adult Aedes females. A: tubule isolated from an unfed mosquito (control). B: tubule isolated from a blood-fed mosquito, 5 min after ending a blood meal (stimulated). C: isolated Malpighian tubule incubated in Ringer solution for 30 min (control). D: isolated Malpighian tubule incubated in 10−3 M dibutyryl (db)-cAMP for 30 min (stimulated). Red staining represents labeling by the AeNHE8 antibody. Sections are counterstained with hematoxylin to stain nuclei and provide contrast. Note that AeNHE8 is not present in every principal cell (e.g., A and C).
Fig. 9.
Fig. 9.
Immunochemical and in vivo fluorescent detection of heterologously expressed AeNHE8 in Xenopus oocytes. A: Western blotting on isolated membrane fractions from Xenopus oocytes 7 days after injection with H2O, AeNHE8 cRNA (28 ng), or AeNHE8-enhanced green fluorescent protein (eGFP) cRNA (28 ng). Labeled arrows and brackets indicate protein bands displaying AeNHE8 or GFP immunoreactivity not observed in H2O-injected oocytes. No GFP immunoreactivity was observed in membrane fractions from H2O-injected or AeNHE8 oocytes (data not shown). Molecular mass markers (in kDa) and antibodies used for each strip are indicated. Strip numbers are referred to in the text. See Supplemental Fig. 2 for overexposed versions of the same blots. B: fluorescent images of Xenopus oocytes injected with H2O or 28 ng of AeNHE8-eGFP cRNA. Dashed circle outlines the location of the H2O-injected oocyte, of which only the less-pigmented vegetal pole is visible.
Fig. 10.
Fig. 10.
Current-voltage (I-V) plots of AeNHE8-expressing and H2O-injected oocytes. Negative membrane current (Im) values represent the net movement of positive charge into or negative charge out of the cell (inward current), whereas positive Im values represent the net movement of positive charge out of or negative charge into the cell (outward current). Data were acquired in solution 1. Values are means ± SE based on the number of oocytes in parentheses. Missing error bars indicate values too small to draw.
Fig. 11.
Fig. 11.
Effects of removing and restoring extracellular Na+ concentration ([Na+]o) in the absence or presence of EIPA on intracellular pH (pHi) and Vm. A: representative recordings of pHi and membrane voltage (Vm) in an AeNHE8 oocyte. Extracellular concentrations (in mM) of Na+ and EIPA are indicated above the recordings. When Na+ is removed, it is replaced by NMDG+. Solution changes are indicated by dashed vertical lines. In the pHi tracing, the dashed lines (labeled a, b, c, etc.) are slopes to indicate the rates of pHi change (ΔpHit). A time bar is included. B: representative recordings of pHi and Vm in a H2O-injected oocyte, using a protocol similar to that in A. C: extracellular solution changes (arrows) after which the ΔpHit and ΔVm measurements were made in AeNHE8 and H2O-injected oocytes. The step-changes in [Na+]o associated with the solution changes are indicated (values in mM). D: summary of ΔpHit measurements. Shaded bars represent ΔpHit values of AeNHE8 oocytes (number of oocytes in parentheses) after the solution changes depicted in C. The value for removing [Na+]o represents the combined mean ΔpHit from periods a and c in A. The open bars represent H2O-injected oocytes at similar periods. E: summary of ΔVm measurements. Shaded bars represent ΔVm values of AeNHE8 oocytes measured 90 s after the solution changes depicted in C. The value for removing Na+ represents the combined mean ΔVm from A and C in A. The open bars represent H2O-injected oocytes after similar solution changes. Values are means ± SE. A missing error bar indicates a value too small to draw. Curved brackets connecting shaded and open bars represent unpaired t-tests that resulted in significant differences. Solid horizontal lines between shaded bars represent Bonferroni post hoc comparisons from a 1-way paired ANOVA. *P < 0.05, **P < 0.01, ***P < 0.001.
Fig. 12.
Fig. 12.
Effects of replacing extracellular Na+ with Li+ or K+ on pHi and Vm. A: representative recordings of pHi and Vm in an AeNHE8 oocyte. Extracellular concentrations (in mM) of Na+, Li+, and K+ are indicated above the recordings. When Na+ is lowered, it is replaced by NMDG+, if not by Li+ or K+. Solution changes are indicated by dashed vertical lines. In the pHi tracing, the dashed lines (labeled a, b, c, etc.) are slopes to indicate the rates of pHi change (ΔpHit). A time bar is included. B: representative recordings of pHi and Vm in a H2O-injected oocyte, using a protocol similar to that in A. C: extracellular solution changes (arrows) after which the ΔpHit and ΔVm measurements were made in AeNHE8 and H2O-injected oocytes. The step-changes in extracellular cation concentration ([cation]o) associated with the solution changes are indicated (values in mM). D: summary of ΔpHit measurements. Shaded bars represent ΔpHit values of AeNHE8 oocytes (number of oocytes in parentheses) after the solution changes depicted in C. The value for lowering [Na+]o represents the combined mean ΔpHit from periods a and c in A. The value for restoring [Na+]o represents the combined mean ΔpHit from periods b and g in A. The open bars represent H2O-injected oocytes at similar periods. E: summary of ΔVm measurements. Shaded bars represent ΔVm values of AeNHE8 oocytes measured 90 s after the solution changes depicted in C. The value for lowering [Na+]o represents the combined mean ΔVm from periods A and C in A. The open bars represent H2O-injected oocytes after similar solution changes. Values are means ± SE. Curved brackets connecting shaded and open bars represent unpaired t-tests that resulted in significant differences. Solid horizontal lines between shaded bars represent Bonferroni post hoc comparisons from a 1-way paired ANOVA. **P < 0.01, ***P < 0.001.
Fig. 13.
Fig. 13.
Effects of monovalent cations on Im of AeNHE8 oocytes. A: representative recording of Im in an AeNHE8 oocyte. Negative Im values represent the movement of positive charge into the cell or negative charge out of the cell (inward current). The double-headed arrow indicates the start of the voltage clamp. The Vm of the oocyte and extracellular concentrations of cations (in mM) of Na+, Li+, and K+ are indicated above the recording. When Na+ is lowered, it is replaced by NMDG+ if not by Li+ or K+. Solution changes are indicated by dashed vertical lines. A time bar is included. B: representative recording of Im in a H2O-injected oocyte, using a protocol similar to that in A. C: summary of relative effects of monovalent cations on inward currents of AeNHE8 oocytes. The shaded bars represent the inward current produced by replacing the lowered [Na+]o with various monovalent cations using the protocol in A. All Im values are standardized to the inward Im produced upon restoration of the normal [Na+]o (i.e., Na+ and the dashed line). Respective currents from H2O-injected oocytes have been subtracted. Values are means ± SE, based on measurements from the number of AeNHE8 oocytes in parentheses. Lower-case letters indicate grouping of means by Newman-Keuls post hoc comparisons from a 1-way unpaired ANOVA.
Fig. 14.
Fig. 14.
Effects of inhibitors on Im of AeNHE8 oocytes. A: representative recording of Im in an AeNHE8 oocyte. In this tracing, the effects of Gd3+ on Im are shown. Negative Im values represent the movement of positive charge into the cell or negative charge out of the cell (inward current). The double-headed arrow indicates the start of the voltage clamp. The Vm of the oocyte and extracellular concentrations of Na+ and Gd3+ (in mM) are indicated above the recording. When Na+ is lowered, it is replaced by NMDG+. Solution changes are indicated by dashed vertical lines. A time bar is included. B: representative recording of Im in a H2O-injected oocyte, using a protocol similar to that in A. C: summary of the relative effects of inhibitors on the inward currents of AeNHE8 oocytes. The shaded bars represent the percent inhibition of the inward Im associated with restoration of normal [Na+]o using the protocol in A. Concentrations of the inhibitors are indicated. The inhibition is calculated by comparing the ΔIm after restoration of normal [Na+]o in the absence of an inhibitor (e.g., b in A) to that after restoration of normal [Na+]o in the presence of an inhibitor (e.g., d in A). Values are means ± SE, based on measurements from the number of AeNHE8 oocytes in parentheses. Lower-case letters indicate grouping of means by Newman-Keuls post-hoc comparisons from a 1-way unpaired ANOVA. Significant inhibition of the inward Im by the inhibitor (**P < 0.01 and ***P < 0.001).

Similar articles

Cited by

References

    1. Ahearn GA, Clay LP. Kinetic analysis of electrogenic 2Na+-1H+ antiport in crustacean hepatopancreas. Am J Physiol Regul Integr Comp Physiol 257: R484–R493, 1989. - PubMed
    1. Ahearn GA, Franco P. Electrogenic 2Na+/H+ antiport in Echinoderm gastrointestinal epithelium. J Exp Biol 158: 495–508, 1991. - PubMed
    1. Becker AM, Zhang J, Goyal S, Dwarakanath V, Aronson PS, Moe OW, Baum M. Ontogeny of NHE8 in the rat proximal tubule. Am J Physiol Renal Physiol 293: F255–F261, 2007. - PMC - PubMed
    1. Bendtsen JD, Nielsen H, von Heijne G, Brunak S. Improved prediction of signal peptides: SignalP 3.0. J Mol Biol 340: 783–795, 2004. - PubMed
    1. Beyenbach KW Energizing epithelial transport with the vacuolar H+-ATPase. News Physiol Sci 16: 145–151, 2001. - PubMed

MeSH terms

LinkOut - more resources