

A single-sample method for normalizing and combining full-resolution copy numbers from multiple platforms, labs and analysis methods
- PMID: 19193730
- PMCID: PMC2660872
- DOI: 10.1093/bioinformatics/btp074
A single-sample method for normalizing and combining full-resolution copy numbers from multiple platforms, labs and analysis methods
Abstract
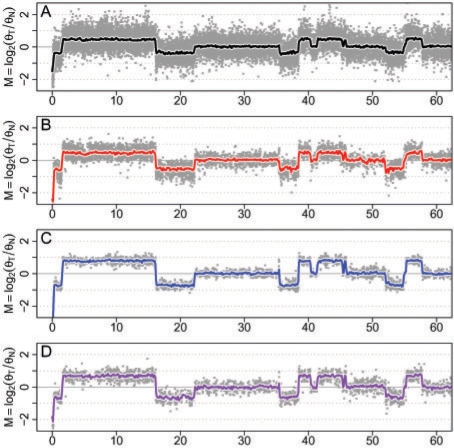
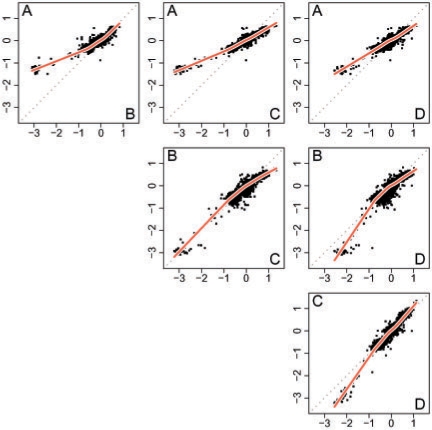
Motivation: The rapid expansion of whole-genome copy number (CN) studies brings a demand for increased precision and resolution of CN estimates. Recent studies have obtained CN estimates from more than one platform for the same set of samples, and it is natural to want to combine the different estimates in order to meet this demand. Estimates from different platforms show different degrees of attenuation of the true CN changes. Similar differences can be observed in CNs from the same platform run in different labs, or in the same lab, with different analytical methods. This is the reason why it is not straightforward to combine CN estimates from different sources (platforms, labs and analysis methods).
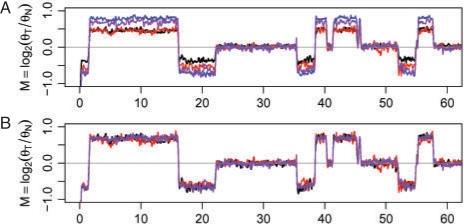
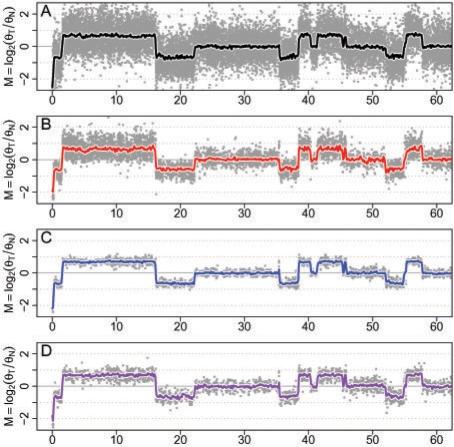
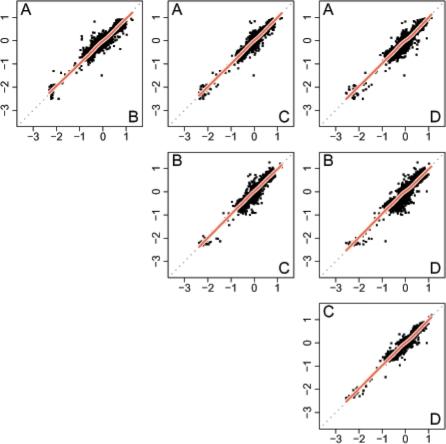
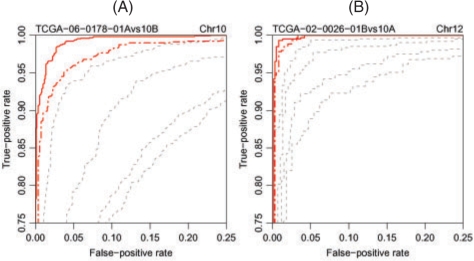
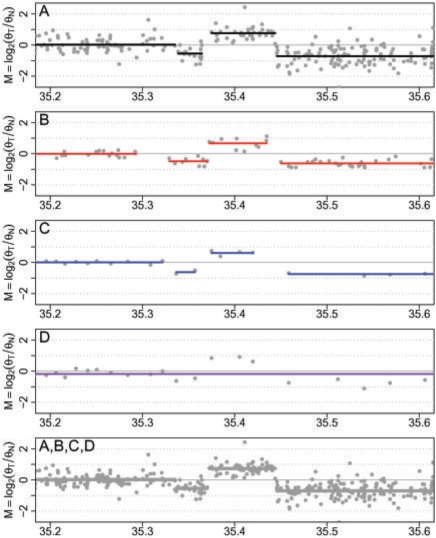
Results: We propose a single-sample multi source normalization that brings full-resolution CN estimates to the same scale across sources. The normalized CNs are such that for any underlying CN level, their mean level is the same regardless of the source, which make them better suited for being combined across sources, e.g. existing segmentation methods may be used to identify aberrant regions. We use microarray-based CN estimates from 'The Cancer Genome Atlas' (TCGA) project to illustrate and validate the method. We show that the normalized and combined data better separate two CN states at a given resolution. We conclude that it is possible to combine CNs from multiple sources such that the resolution becomes effectively larger, and when multiple platforms are combined, they also enhance the genome coverage by complementing each other in different regions.
Availability: A bounded-memory implementation is available in aroma.cn.
Figures
Similar articles
-
TumorBoost: normalization of allele-specific tumor copy numbers from a single pair of tumor-normal genotyping microarrays.BMC Bioinformatics. 2010 May 12;11:245. doi: 10.1186/1471-2105-11-245. BMC Bioinformatics. 2010. PMID: 20462408 Free PMC article.
-
Estimation and assessment of raw copy numbers at the single locus level.Bioinformatics. 2008 Mar 15;24(6):759-67. doi: 10.1093/bioinformatics/btn016. Epub 2008 Jan 19. Bioinformatics. 2008. PMID: 18204055
-
Folic acid supplementation and malaria susceptibility and severity among people taking antifolate antimalarial drugs in endemic areas.Cochrane Database Syst Rev. 2022 Feb 1;2(2022):CD014217. doi: 10.1002/14651858.CD014217. Cochrane Database Syst Rev. 2022. PMID: 36321557 Free PMC article.
-
Joint estimation of DNA copy number from multiple platforms.Bioinformatics. 2010 Jan 15;26(2):153-60. doi: 10.1093/bioinformatics/btp653. Epub 2009 Nov 20. Bioinformatics. 2010. PMID: 19933593 Free PMC article.
-
PanCancer insights from The Cancer Genome Atlas: the pathologist's perspective.J Pathol. 2018 Apr;244(5):512-524. doi: 10.1002/path.5028. Epub 2018 Feb 22. J Pathol. 2018. PMID: 29288495 Free PMC article. Review.
Cited by
-
Prognostic value of SOX9 in cervical cancer: Bioinformatics and experimental approaches.Front Genet. 2022 Aug 8;13:939328. doi: 10.3389/fgene.2022.939328. eCollection 2022. Front Genet. 2022. PMID: 36003340 Free PMC article.
-
Visualization of genomic changes by segmented smoothing using an L0 penalty.PLoS One. 2012;7(6):e38230. doi: 10.1371/journal.pone.0038230. Epub 2012 Jun 5. PLoS One. 2012. PMID: 22679492 Free PMC article.
-
Phagocytosis of Glioma Cells Enhances the Immunosuppressive Phenotype of Bone Marrow-Derived Macrophages.Cancer Res. 2023 Mar 2;83(5):771-785. doi: 10.1158/0008-5472.CAN-22-1570. Cancer Res. 2023. PMID: 36622331 Free PMC article.
-
arrayMap: a reference resource for genomic copy number imbalances in human malignancies.PLoS One. 2012;7(5):e36944. doi: 10.1371/journal.pone.0036944. Epub 2012 May 18. PLoS One. 2012. PMID: 22629346 Free PMC article.
-
Mirror extreme BMI phenotypes associated with gene dosage at the chromosome 16p11.2 locus.Nature. 2011 Aug 31;478(7367):97-102. doi: 10.1038/nature10406. Nature. 2011. PMID: 21881559 Free PMC article.
References
-
- Ben-Yaacov E, Eldar YC. A fast and flexible method for the segmentation of aCGH data. Bioinformatics. 2008;24:i139–i145. - PubMed
-
- Bengtsson H. Ph.D. Thesis, Centre for Mathematical Sciences, Division of Mathematical Statistics. Lund University; 2004. Low-level analysis of microarray data.
-
- Bengtsson H, et al. Technical Report 745. Berkeley: Department of Statistics, University of California; 2008a. aroma.affymetrix: a generic framework in R for analyzing small to very large Affymetrix data sets in bounded memory.
Publication types
MeSH terms
Grants and funding
LinkOut - more resources
Full Text Sources
Other Literature Sources
Miscellaneous
