. 2009 Apr;101(4):2089-106.
doi: 10.1152/jn.90654.2008. Epub 2009 Feb 4.

Attentional modulation of visual responses by flexible input gain

Affiliations

Attentional modulation of visual responses by flexible input gain

Geoffrey M Ghose. J Neurophysiol. 2009 Apr.

Abstract

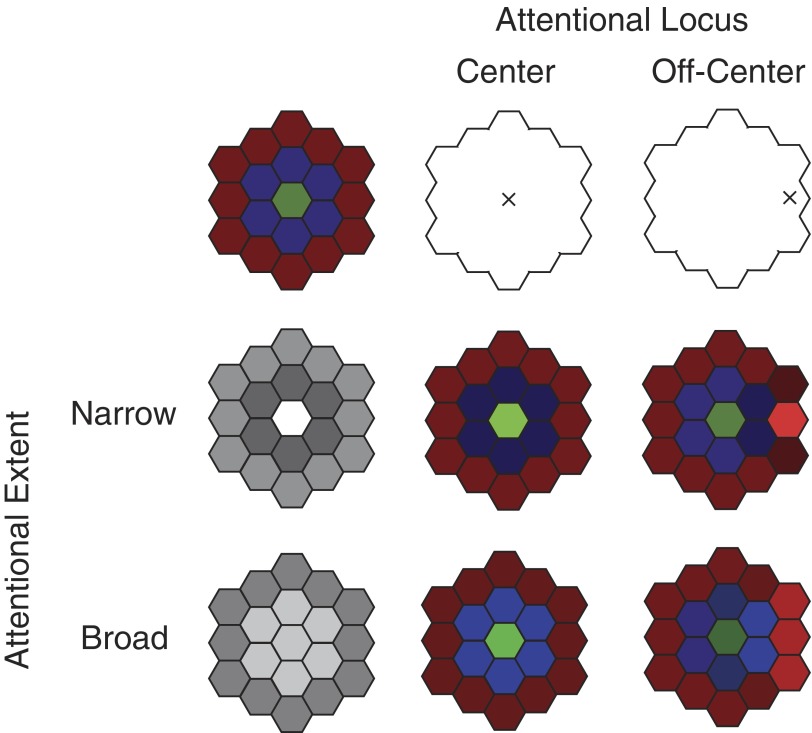
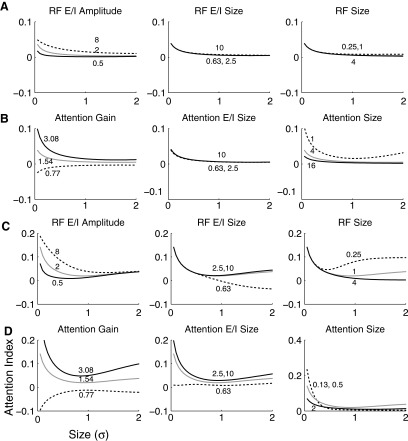
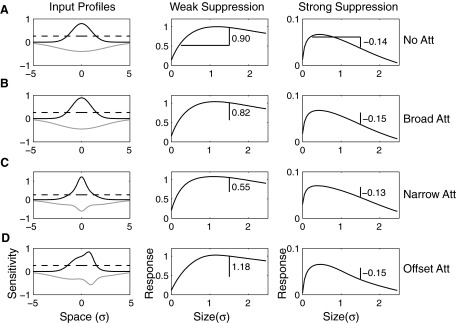
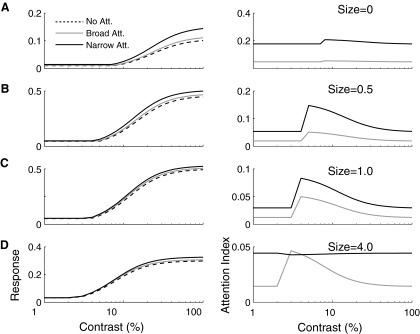
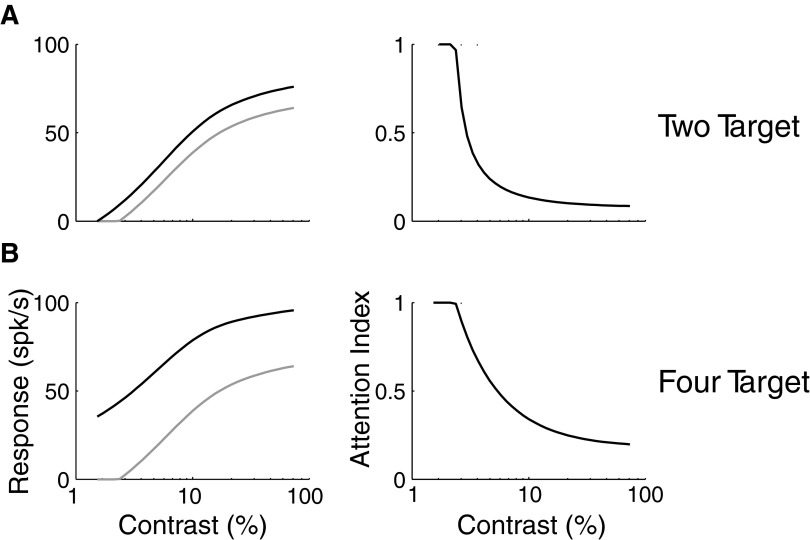
Although it is clear that sensory responses in the cortex can be strongly modulated by stimuli outside of classical receptive fields as well as by extraretinal signals such as attention and anticipation, the exact rules governing the neuronal integration of sensory and behavioral signals remain unclear. For example, most experiments studying sensory interactions have not explored attention, while most studies of attention have relied on the responses to relatively limited sets of stimuli. However, a recent study of V4 responses, in which location, orientation, and spatial attention were systematically varied, suggests that attention can both facilitate and suppress specific sensory inputs to a neuron according to behavioral relevance. To explore the implications of such input gain, we modeled the effects of a center-surround organization of attentional modulation using existing receptive field models of sensory integration. The model is consistent with behavioral measurements of a suppressive effect that surrounds the facilitatory locus of spatial attention. When this center-surround modulation is incorporated into realistic models of sensory integration, it is able to explain seemingly disparate observations of attentional effects in the neurophysiological literature, including spatial shifts in receptive field position and the preferential modulation of low contrast stimuli. The model is also consistent with recent formulations of attention to features in which gain is variably applied among cells with different receptive field properties. Consistent with functional imaging results, the model predicts that spatial attention effects will vary between different visual areas and suggests that attention may act through a common mechanism of selective and flexible gain throughout the visual system.


Figures

FIG. 1.
FIG. 1.
Input gain model of spatially variant attentional modulation for a center-surround receptive field. Responses in the absence of attention are determined by the relative activation of different sets of inputs (red, green, and blue; top left). Attention modulates the gain of those inputs in a spatially specific manner so that neuronal response reflects the relative activation of behavioral modulated inputs. In this cartoon, attentional modulation varies over space according to a center-surround organization (left), with facilitation (white) at the center, and suppression (dark gray) at the surround. The effect of attention varies according to both the locus and spread of attention. Highly localized attention can substantially alter the relative weighting of different sensory inputs depending on its locus (right), while broadly distributed attention does not substantially alter the relative activity of a particular subset of inputs.
FIG. 2.
FIG. 2.
Spatially localized orientation change detection tasks. Left to right: temporal sequence of stimuli; +, fixation point; •, the receptive field (RF) of the V4 neuron under study. Monkeys were cued to pay attention to a particular location (location 1 in AD) and only release a lever immediately after an orientation change occurred at that location, (center to right panels), while ignoring changes at all other locations (left to center panels). The behaviorally relevant location was cued with an instruction trial (not shown) in which only 1 stimulus was present. Subsequent trials within a cued location block included conditions in which only a single stimulus was present in the RF (A and C) and conditions in which pairs of stimuli were present (B and D).
FIG. 3.
FIG. 3.
Input gain model fit and parameters for 2-target (monkey Y) and 4-target data (monkeys P and T). Normalized error (sum of errors squared divided by explainable variance) for the input gain vs. output gain models is plotted for the 2-target (triangles, n = 43) and 4-target (circles: monkey P, n = 39; squares: monkey T, n = 51) data sets (A). Filled symbols indicate significant difference in error (F-test, P < 0.05) between input gain model, in which attention is free to vary between the 2 locations within the RF and the output gain model, in which attentional gain is locked throughout the RF. Median errors are indicated along the axes (triangles, monkey Y; diamonds: monkey P; arcs, monkey T). While input gain is clearly superior to output gain in explaining the 4-target data for many cells, fewer cells in the 2-target sample are preferentially fit by the input gain model. Similarly, input gain is clearly superior to output gain in explaining the average response observed for the 4-target monkeys (plus and x) but not for the average for the 2-target monkey (asterisk). For the 4-target data (gray, monkey P; black, monkey T), the responses from <10% of cells were equally well explained by the 2 models (B), whereas for the 2-target data (white), the 2 models were equally valid for >35% of neurons. Despite the equivalent behavioral significance of attended and unattended stimuli between recording sessions, gain parameters vary substantially between neurons in both data sets (C). Median input gain parameters for the attended and unattended location are indicated by triangle markers on the axes. There is no obviously clustering of points along the lines corresponding with the simpler single parameter attention models (vertical: filter, diagonal: output gain, and horizontal: spotlight) in any animal. Attended stimulus gains were significantly larger than unattended gains for the 4-target data (filled circles, P < 0.001, paired t-test) but not for the 2-target data (open circles, P = 0.179). Average gain across the sampled neuronal population is significantly positive at the attended location (2-target, P = 0.012; 4-target,P < 0.001) but not significantly different from zero at the unattended location (2-target, P = 1.00; 4-target, P = 0.184).
FIG. 4.
FIG. 4.
Center surround models of input gain fit according the parameters in Fig. 3A. Gain at the attended location is assumed to be maximal at the center of the RF for the 2-target (- - -) and 4-target (···) cases and fixed at 1.38, while gain at the unattended location (x = 1) is 1.1 for 2 targets and 0.91 for 4 targets. Visual sensitivity over space in the absence of attention is modeled by a Gaussian of SD 2 (black, B). RF differences between the 2- and 4-target attention allocations are only apparent near the center of the RF: beyond x = 2, visual sensitivity is virtually identical (B). On the other hand, when attention is directed outside of the receptive field (gray, A), a notable shift toward the direction of attention is apparent in the spatial weighting of the receptive field (gray vs. black), consistent with experimental observations.
FIG. 5.
FIG. 5.
Attentional modulation as a function of stimulus size when parameters of the center-surround gain model are varied. Attention index is the difference between attended and unattended responses divided by the sum of the responses. Space is normalized according to the size of the central excitatory Gaussian in a divisive normalization model of the RF, and attention is centered at the center of the RF (x = 0). The spatial extent of attentional facilitation is defined to be 1 in A and B and 0.5 in C and D. For almost all parameter variations, the effects of attention decrease as stimulus size increases: the strongest attentional effects are seen for small well-centered stimuli. Attention effects are more dependent on RF properties such the strength and size of the surround when attention is narrowly focused (C vs. A). Under most conditions, the exact size of the suppressive region of attention (attention E/I) has a minimal effect of responses. Attention gain, associated with nonspatial factors such as anticipation and task difficulty, is the biggest determinant of the magnitude of attention effects (B and D).
FIG. 6.
FIG. 6.
Attentional effects on extra-RF facilitation and suppression. Spatial summation is described by center and surround inputs with Gaussian profiles in the absence of attention (A, left). Responses are defined by applying a threshold (dotted line) after the inputs of center (black) and surround (gray) inputs (arbitrary units) are multiplied by gains describing their relative influence and then normalized by divisive normalization (Cavanaugh et al. 2002a). Because of this threshold responses to stimuli extending beyond the classical receptive field can be larger than those that are well confined if the surround influence is relatively weak (center). A facilitation index is computed by subtracting one from the ratio of the response to larger stimulus to the response to the smaller stimulus. If the surround influence is weak (surround/center gain = 0.2), a positive facilitation index is observed (center), while if the surround is strong (right, surround/center gain = 4), a negative index, reflecting response suppression, is observed (right). While attention has relatively modest effects of the magnitude of suppression for strongly length-tuned neurons (A vs. B–D, right), it can either increase or decrease facilitation in the case of weak surrounds (A vs. B–D, center). Narrowly focused attention can decrease facilitation (C, center) by selectively increasing the weight of central inputs (C, left). However, narrowly focused attention, if is not centered on the RF, can also increase the relative influence of noncentral inputs (D, left) and therefore increase facilitation (D, center).
FIG. 7.
FIG. 7.
Contrast dependence of attention modulation as a function of stimulus size and the spatial extent of attention. Neuronal responses (left) are in arbitrary units, and attentional modulation (right) is quantified according to the same attention index used in Fig. 5. As with previous figures, stimulus size is normalized according the SD of the central Gaussian in the divisive normalization model. In accordance with Fig. 5, the effect of attention is the greatest for very small well centered stimuli (A). For such stimuli, irrespective of the size of the attentional gain field, attention modulation is consistent across variations in contrast. However, for larger stimuli (B–D), especially those on the order of the size of the RF (C), attentional modulation is larger at intermediate contrasts near threshold then it is for high-contrast stimuli, consistent with a shift in contrast response functions.
FIG. 8.
FIG. 8.
Contrast dependence of attention modulation in MT responses to paired stimulation. Attended (null direction) and unattended (preferred direction) stimuli were modulated according the mean input gain parameters of the 2- and 4-target data (Fig. 4), and the contrast of the unattended stimulus was modulated. Responses with attention (black, A) were increased across all contrasts relative to responses without attention (gray, A). However, this increase was not uniform and, consistent with the responses to single stimuli in Fig. 7, was larger for contrasts near threshold.

Similar articles

Cited by

References

    1. Ardid S, Wang XJ, Compte A. An integrated microcircuit model of attentional processing in the neocortex. J Neurosci 27: 8486–8495, 2007. - PMC - PubMed
    1. Awh E, Armstrong KM, Moore T. Visual and oculomotor selection: links, causes and implications for spatial attention. Trends Cogn Sci 10: 124–130, 2006. - PubMed
    1. Bair W, Cavanaugh J, Movshon J. Time course and time-distance relationships for surround suppression in macaque V1 neurons. J Neurosci 23: 7690–701, 2003. - PMC - PubMed
    1. Born R, Tootell R. Segregation of global and local motion processing in primate middle temporal visual area [published erratum appears in Nature 365: 279, et al. 1993]. Nature 357: 497–499, 1992. - PubMed
    1. Boudreau CE, Williford TH, Maunsell JHR. Effects of task difficulty and target likelihood in area v4 of macaque monkeys. J Neurophysiol 96: 2377–2387, 2006. - PubMed

Publication types

LinkOut - more resources