. 2009 Mar;20(3):567-81.
doi: 10.1681/ASN.2008040424. Epub 2009 Feb 4.

HGF and BMP-7 ameliorate high glucose-induced epithelial-to-mesenchymal transition of peritoneal mesothelium

Affiliations

HGF and BMP-7 ameliorate high glucose-induced epithelial-to-mesenchymal transition of peritoneal mesothelium

Min-A Yu et al. J Am Soc Nephrol. 2009 Mar.

Abstract

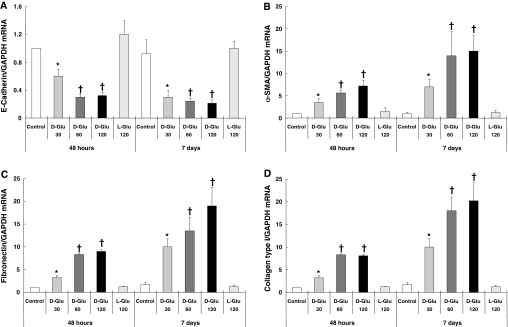
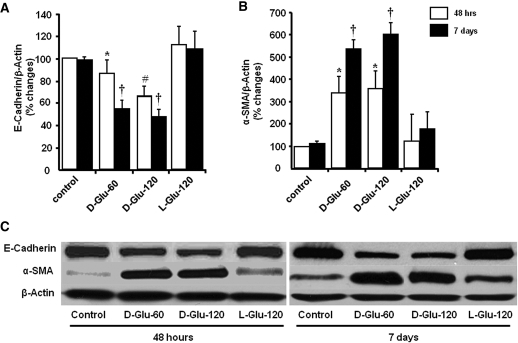
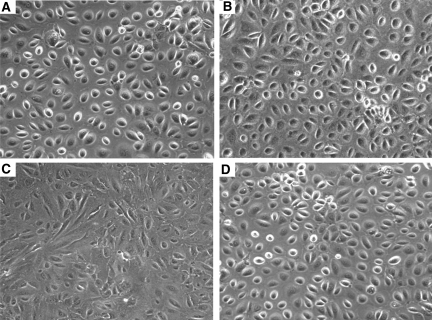
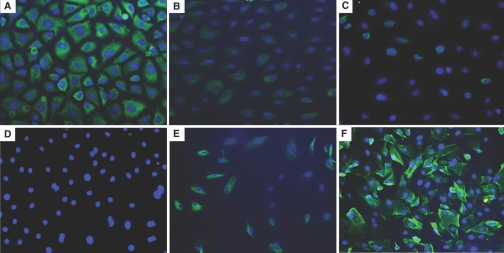
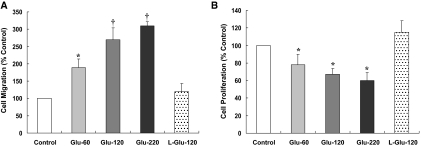
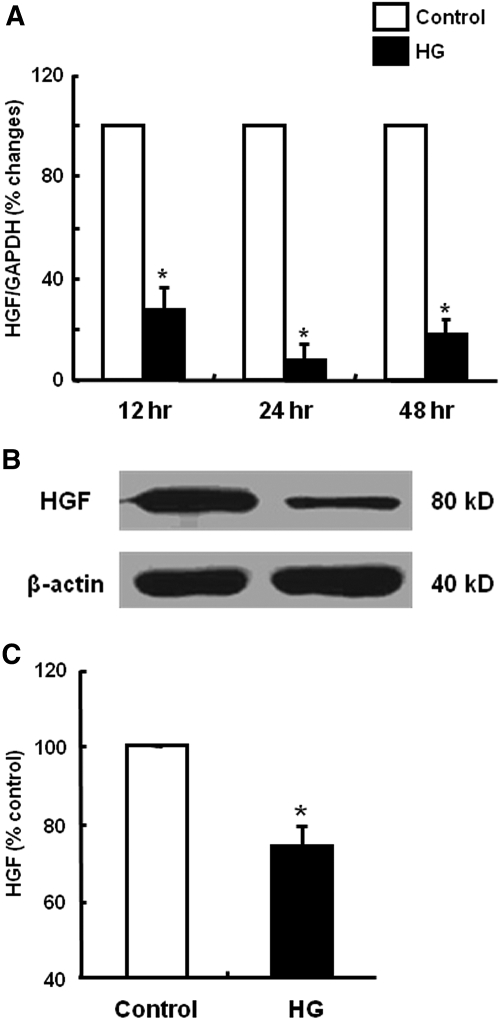
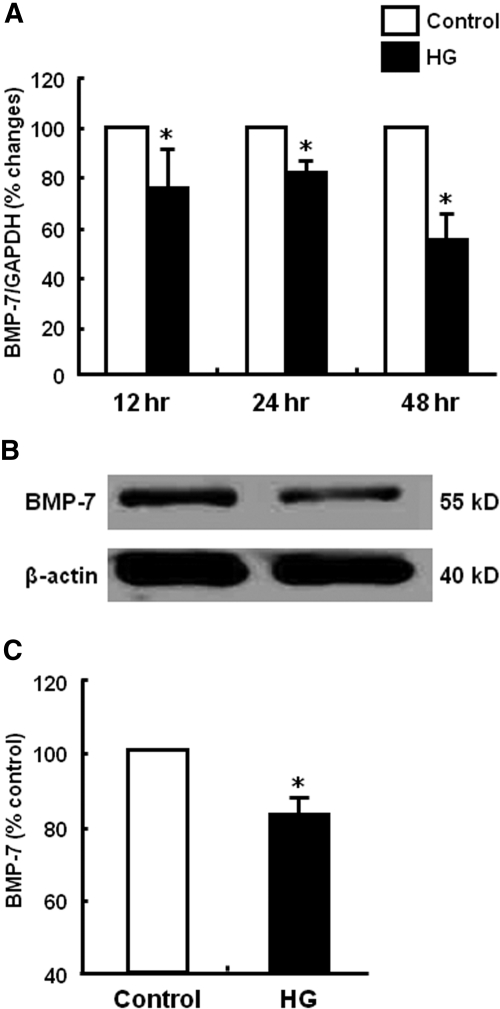
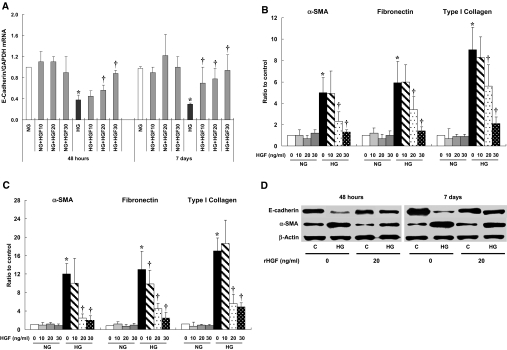
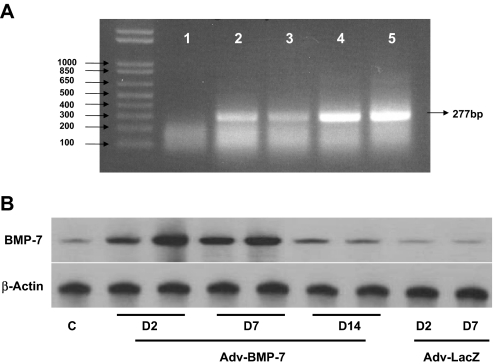
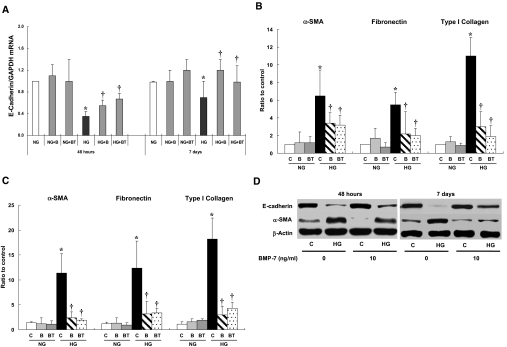
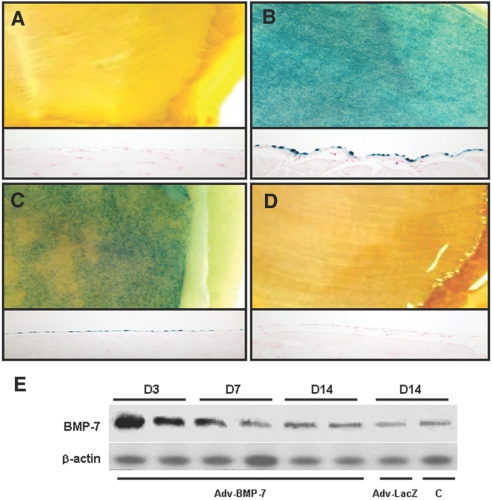
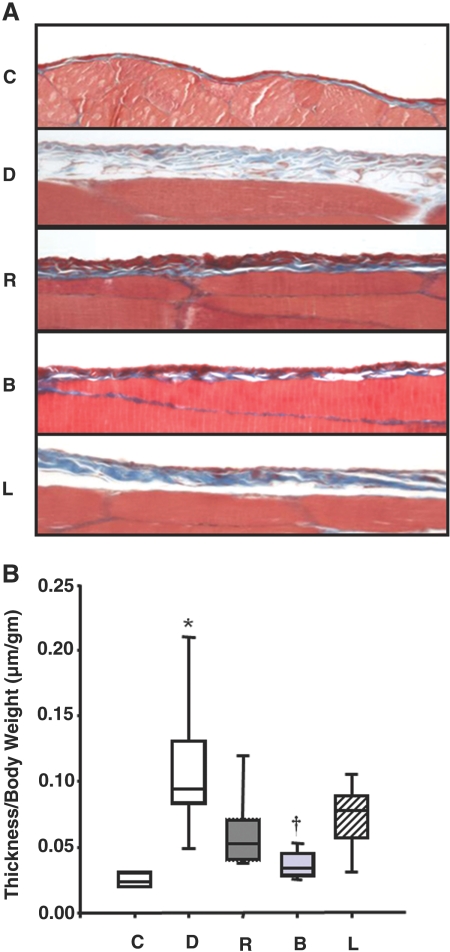
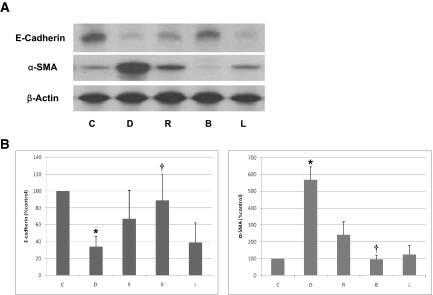
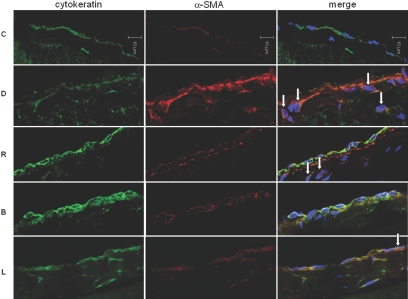
Over time, peritoneal dialysis results in functional and structural alterations of the peritoneal membrane, but the underlying mechanisms and whether these changes are reversible are not completely understood. Here, we studied the effects of high levels of glucose, which are found in the dialysate, on human peritoneal mesothelial cells (HPMCs). We found that high concentrations of glucose induced epithelial-to-mesenchymal transition (EMT) of HPMC, suggested by decreased expression of E-cadherin and increased expression of alpha-smooth muscle actin, fibronectin, and type I collagen and by increased cell migration. Normalization of glucose concentration on day 2 reversed the phenotypic transformation, but the changes were irreversible after 7 d of stimulation with high glucose. In addition, exposure of HPMC to high glucose resulted in a decreased expression of the antifibrotic cytokines, hepatocyte growth factor (HGF) and bone morphogenic protein 7 (BMP-7). Exogenous treatment with HGF resulted in a dosage-dependent prevention of high glucose-induced EMT. Both BMP-7 peptide and gene transfection with an adenoviral vector of BMP-7 also protected HPMCs from EMT. Furthermore, adenoviral BMP-7 transfection decreased peritoneal EMT and ameliorated peritoneal thickening in an animal model of peritoneal dialysis. In summary, high concentrations of glucose induce a reversible EMT of HPMCs, associated with decreased production of HGF and BMP-7. Treatment of HPMCs with HGF or BMP-7 blocks high glucose-induced EMT, and BMP-7 ameliorates peritoneal fibrosis in an animal model of peritoneal dialysis.


Figures

Figure 1.
Figure 1.
Effect of HG on mRNA expression of epithelial and mesenchymal cell markers. HG (d-glucose 30, 60, and 120 mM/L) stimulation induced the EMT of HPMCs shown as a decreased expression of E-cadherin (A) and an increase in the expressions of α-SMA (B), fibronectin (C), and collagen type I (D) at 48 h and 7 d. Glucose concentrations >60 mM/L showed a comparable effect without a definite dosage dependence. l-Glucose (120 mM/L) did not induce any changes in mRNA expression of the markers of epithelial and mesenchymal cells (n = 7). *P < 0.05 versus control and l-glucose at each time point; †P < 0.05 versus control, l-glucose and 30 mM of d-glucose at each time point.
Figure 2.
Figure 2.
Effect of HG on protein expression of E-cadherin and α-SMA. (A and B) HG induced a significant decrease in protein expression of E-cadherin (A) and an increase in α-SMA (B) at 48 h and 7 d of stimulation. (C) Representative Western blot demonstrated HG-induced alteration in E-cadherin and α-SMA (n = 6). *P < 0.05 versus control and l-glucose of 48 h; †P < 0.05 versus control and l-glucose of day 7 and d-glucose of 48 h at each glucose concentration; #P < 0.05 versus control, l-glucose, and 60 mM of d-glucose at 48 h.
Figure 3.
Figure 3.
Effect of HG on cell morphology. (A and C) Representative photomicrograph shows the cobblestone-like appearance of normal mesothelial cells (A), which converted into a fibroblast-like morphology after continuous stimulation with HG (60 mM/L d-glucose) for 7 d (C). (B and D) There was no significant change in cell shape with 2 d of stimulation of d-glucose (60 mM/L; B) or 7 d stimulation of l-glucose (60 mM/L; D). n = 5. Magnification, ×100.
Figure 4.
Figure 4.
Effect of HG on cytokeratin and α-SMA expression. In parallel to morphologic changes, HG (B, C, E, and F) also decreased the expression of the epithelial marker cytokeratin (A through C) with an increase in the expression of α-SMA (D through F) at day 2 (B and E) and day 7 (C and F) compared with control (A and D). n = 5. Magnification, ×200.
Figure 5.
Figure 5.
Reversibility of HG-induced EMT of HPMCs. (A and B) HG-induced alteration in protein expression of E-cadherin (A) and α-SMA (B) was reversible with an exposure to media with normal glucose (NG) concentration after 48 h of HG stimulation; however, it became irreversible after 7 d of exposure to HG. (C) Representative Western blot demonstrated HG-induced EMT and its reversibility. n = 6. *P < 0.05 versus control at each time point.
Figure 6.
Figure 6.
Effect of HG on migration and proliferation of HPMCs. (A and B) Stimulation of HPMCs with HG for 48 h induced cell migration assessed by Boyden chamber assay (A), whereas it inhibited the proliferation of HPMCs (B). n = 5. *P < 0.05 versus control and l-glucose; †P < 0.05 versus control, l-glucose, and 60 mM/L d-glucose.
Figure 7.
Figure 7.
Effect of HG on HGF production of HPMCs. (A) HG (60 mM/L d-glucose) induced a decrease in HGF mRNA expression from 12 to 48 h. (B and C) HG also decreased the production of HGF protein at 48 h assessed by Western blotting (B) and ELISA (C). n = 5. *P < 0.05 versus control at each time point.
Figure 8.
Figure 8.
Effect of HG on BMP-7 production of HPMCs. (A) HG (60 mM/L d-glucose) induced a decrease in BMP-7 mRNA expression from 12 to 48 h. (B and C) HG also decreased the production of BMP-7 protein at 48 h assessed by Western blotting (B) and ELISA (C). n = 5. *P < 0.05 versus control at each time point.
Figure 9.
Figure 9.
Effect of rHGF on HG-induced EMT of HPMCs. (A through C) rHGF ameliorated HG-induced alteration in mRNA expressions of E-cadherin (A) and α-SMA, fibronectin, and type I collagen from a dosage of 20 ng/ml at 48 h (B) and 7 d (C) of treatment. (D) Representative Western blotting shows an amelioration of HG-induced changes in E-cadherin and α-SMA with 20 ng/ml rHGF. n = 6 for real-time PCR, and n = 5 for Western blotting. *P < 0.05 versus NG at each time point; †P < 0.05 versus HG at each time point.
Figure 10.
Figure 10.
Expression of BMP-7 mRNA and protein of HPMCs after adenoviral gene transfer. (A) Representative RT-PCR shows BMP-7 gene abundance with Adv-BMP-7 transfection (lanes 4 and 5) compared with negative control (lane 1), nontransfected control (lane 2), or Adv-LacZ transfection (lane 3) at 48 h after transfection. (B) Representative Western blot shows a time course of BMP-7 protein production, which is maintained in high abundance up to 7 d (D7) of Adv-BMP-7 transfection compared with control without transfection (C) or Adv-LacZ transfection.
Figure 11.
Figure 11.
Effect of BMP-7 on HG-induced EMT of HPMCs. (A through C) Both rBMP-7 (10 ng/ml; B) and Adv-BMP-7 gene transfection (BT) ameliorated HG-induced alteration in mRNA expressions of E-cadherin (A) and α-SMA, fibronectin, and type I collagen at 48 h (B) and 7 d (C) of treatment. (D) Representative Western blotting shows an amelioration of HG-induced changes in E-cadherin and α-SMA with 10 ng/ml BMP-7. n = 6 for real-time PCR, and n = 5 for Western blotting. *P < 0.05 versus NG at each time point; †P < 0.05 versus HG at each time point.
Figure 12.
Figure 12.
Effect of combined treatment of HGF or BMP-7 peptides with a removal of HG on phenotypic transformation of HPMCs after long-term stimulation with HG. (A through E) Morphologic transformation of cells before (A) and after (B) continuous stimulation with HG for 7 d, which is not reversible with a switch of culture medium with NG concentration for 2 d (C), is ameliorated with combined treatment of removal of HG and HGF (20 ng/ml; D) or BMP-7 (10 ng/ml; E) treatment for 2 d. (F through I) Immunofluorescence microscope reveals that altered expression of cytokeratin (F and G) and α-SMA (H and I) in HG-stimulated cells (F and H) is recovered with HG removal and BMP-7 peptide treatment for 2 d (G and I). Magnifications: ×100 in A through E; ×250 in F through I.
Figure 13.
Figure 13.
Expression of β-gal and BMP-7 in an animal model of PD after adenoviral gene transfer. (A through D) Gross morphology of abdominal walls (top) and the expression of X-gal were evaluated by histochemical staining with X-gal (bottom) after intraperitoneal injection with Adv-LacZ (A, control; B, 3 d after injection; C, 7 d after injection; D, 14 d after injection). An increased expression was noted until 7 d after injection, and it is reduced to the level of control after 14 d. (E) Representative Western blot shows BMP-7 protein abundance in rat peritoneum up to 14 d (D14) after Adv-BMP-7 gene transfer compared with Adv-LacZ transfection or control (C) without transfection at day 14 (D14).
Figure 14.
Figure 14.
Effect of BMP-7 on thickness of peritoneal membrane. (A) Trichrome-stained parietal peritoneum of abdominal wall shows a marked increase in submesothelial matrix in group D (dialysis), which is ameliorated by peritoneal rest (group R). Adv-BMP-7 transfection (group B) further decreases peritoneal thickening compared with groups R and L (Adv-LacZ transfection). (B) The peritoneal thickness/body weight (μm/g) assessed by morphometric analysis is increased in group D compared with group C (control) and group R, which is further decreased in group B. *P < 0.05 versus other groups; †P < 0.05 versus groups D, R, and L. Horizontal lines at the top, middle, and bottom of the boxes show the 75th, 50th, and 25th percentiles, respectively, and vertical lines above and below the boxes show the 90th and 10th percentiles, respectively. Magnification, ×400.
Figure 15.
Figure 15.
Effect of BMP-7 on EMT of peritoneum. (A and B) Representative Western blot (A) and quantitative analysis (B) demonstrate the EMT of rat peritoneum shown as a decrease in E-cadherin and an increase in α-SMA in group D (dialysis). Altered expression of E-cadherin and α-SMA in group D is ameliorated by peritoneal rest (group R), which is further improved by Adv-BMP-7 transfection (group B). Adv-LacZ transfection (group L) shows no additional benefit in reversing EMT. *P < 0.05 versus other groups; †P < 0.05 versus groups D, R, and L.
Figure 16.
Figure 16.
Effect of BMP-7 on the number of submesothelial myofibroblast in an animal model of PD. Immunofluorescence microscopy stained for cytokeratin (green) and α-SMA (red) with nuclear counterstain (blue, DAPI) demonstrates an increase in submesothelial dual-stained cytokeratin- and α-SMA–positive myofibroblasts (arrow) in group D associated with a decrease in cytokeratin and an increase in α-SMA expression. Peritoneal rest decreases the number of these cells in group R, which is further decreased by Adv-BMP-7 transfection (group B). Magnification, ×640.

Similar articles

Cited by

References

    1. Davies SJ, Phillips L, Griffiths AM, Russell LH, Naish PF, Russell GI: What really happens to people on long-term peritoneal dialysis? Kidney Int 54: 2207–2217, 1998 - PubMed
    1. Krediet RT: The peritoneal membrane in chronic peritoneal dialysis. Kidney Int 55: 341–356, 1999 - PubMed
    1. Davies SJ, Phillips L, Naish PF, Russell GI: Peritoneal glucose exposure and changes in membrane solute transport with time on peritoneal dialysis. J Am Soc Nephrol 12: 1046–1051, 2001 - PubMed
    1. Holmes CJ, Faict D: Peritoneal dialysis solution biocompatibility: Definitions and evaluation strategies. Kidney Int Suppl 64: S50–S56, 2003 - PubMed
    1. Cendoroglo M, Sundaram S, Jaber BL, Pereira BJ: Effect of glucose concentration, osmolality, and sterilization process of peritoneal dialysis fluids on cytokine production by peripheral blood mononuclear cells and polymorphonuclear cell functions in vitro. Am J Kidney Dis 31: 273–282, 1998 - PubMed

Publication types

MeSH terms