Kinetic analysis of human T-cell leukemia virus type 1 gene expression in cell culture and infected animals
- PMID: 19193802
- PMCID: PMC2663277
- DOI: 10.1128/JVI.02315-08
Kinetic analysis of human T-cell leukemia virus type 1 gene expression in cell culture and infected animals
Abstract
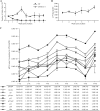
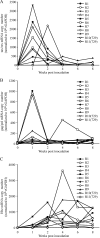
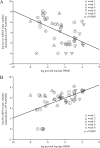
Human T-cell leukemia virus type 1 (HTLV-1) infection causes adult T-cell leukemia and is associated with a variety of lymphocyte-mediated disorders. It has been hypothesized that a highly regulated pattern of HTLV-1 gene expression is critical for virus survival and disease pathogenesis. In this study, real-time reverse transcriptase PCR was used to determine the kinetics of viral gene expression in cells transiently transfected with an HTLV-1 proviral plasmid, in newly infected human peripheral blood mononuclear cells (PBMCs), and in PBMCs from newly infected rabbits. The HTLV-1 gene expression profiles in transiently transfected and infected cells were similar; over time, all transcripts increased and then maintained stable levels. gag/pol, tax/rex, and env mRNA were detected first and at the highest levels, whereas the expression levels of the accessory genes, including the antisense Hbz, were significantly lower than the tax/rex levels (ranging from 1 to 4 logs depending on the specific mRNA). In infected rabbits, tax/rex and gag/pol mRNA levels peaked early after inoculation and progressively decreased, which correlated inversely with the proviral load and host antibody response against viral proteins. Interestingly, Hbz mRNA was detectable at 1 week postinfection and increased and stabilized. The expression levels of all other HTLV-1 genes in infected rabbit PBMCs were at or below our limit of detection. This analysis provides insight into viral gene expression under various in vitro and in vivo experimental conditions. Our in vivo data indicate that in infected rabbits, Hbz mRNA expression over time directly correlates with the proviral load, which provides the first evidence linking Hbz expression to proviral load and the survival of the virus-infected cell in the host.
Figures


Similar articles
-
HTLV-1 Rex is required for viral spread and persistence in vivo but is dispensable for cellular immortalization in vitro.Blood. 2003 Dec 1;102(12):3963-9. doi: 10.1182/blood-2003-05-1490. Epub 2003 Aug 7. Blood. 2003. PMID: 12907436 Free PMC article.
-
Regulation of human T-lymphotropic virus type I latency and reactivation by HBZ and Rex.PLoS Pathog. 2014 Apr 3;10(4):e1004040. doi: 10.1371/journal.ppat.1004040. eCollection 2014 Apr. PLoS Pathog. 2014. PMID: 24699669 Free PMC article.
-
Evaluation of HTLV-1 HBZ and proviral load, together with host IFN λ3, in pathogenesis of HAM/TSP.J Med Virol. 2017 Jun;89(6):1102-1107. doi: 10.1002/jmv.24721. Epub 2016 Nov 10. J Med Virol. 2017. PMID: 27787900
-
Mechanisms of human T-lymphotropic virus type 1 transmission and disease.Curr Opin Virol. 2012 Aug;2(4):474-81. doi: 10.1016/j.coviro.2012.06.007. Epub 2012 Jul 20. Curr Opin Virol. 2012. PMID: 22819021 Review.
-
[Adult T-cell leukemia induced by HTLV-1: before and after HBZ].Med Sci (Paris). 2010 Apr;26(4):391-6. doi: 10.1051/medsci/2010264391. Med Sci (Paris). 2010. PMID: 20412744 Review. French.
Cited by
-
Silencers of HTLV-1 and HTLV-2: the pX-encoded latency-maintenance factors.Retrovirology. 2019 Sep 6;16(1):25. doi: 10.1186/s12977-019-0487-9. Retrovirology. 2019. PMID: 31492165 Free PMC article. Review.
-
Role of Exosomes in Human Retroviral Mediated Disorders.J Neuroimmune Pharmacol. 2018 Sep;13(3):279-291. doi: 10.1007/s11481-018-9784-7. Epub 2018 Apr 14. J Neuroimmune Pharmacol. 2018. PMID: 29656370 Review.
-
The human T-cell leukemia virus type-1 tax oncoprotein dissociates NF-κB p65RelA-Stathmin complexes and causes catastrophic mitotic spindle damage and genomic instability.Virology. 2019 Sep;535:83-101. doi: 10.1016/j.virol.2019.07.003. Epub 2019 Jul 3. Virology. 2019. PMID: 31299491 Free PMC article.
-
RNA stability regulates human T cell leukemia virus type 1 gene expression in chronically-infected CD4 T cells.Virology. 2017 Aug;508:7-17. doi: 10.1016/j.virol.2017.04.029. Epub 2017 May 4. Virology. 2017. PMID: 28478312 Free PMC article.
-
HTLV-1 intragenic viral enhancer influences immortalization phenotype in vitro, but is dispensable for persistence and disease development in animal models.Front Immunol. 2022 Jul 25;13:954077. doi: 10.3389/fimmu.2022.954077. eCollection 2022. Front Immunol. 2022. PMID: 35958554 Free PMC article.
References
-
- Anderson, M. D., J. Ye, L. Xie, and P. L. Green. 2004. Transformation studies with a human T-cell leukemia virus type 1 molecular clone. J. Virol. Methods 116195-202. - PubMed
-
- Awasthi, S., A. Sharma, K. Wong, J. Zhang, E. F. Matlock, L. Rogers, P. Motloch, S. Takemoto, H. Taguchi, M. D. Cole, B. Luscher, O. Dittrich, H. Tagami, Y. Nakatani, M. McGee, A. M. Girard, L. Gaughan, C. N. Robson, R. J. Monnat, Jr., and R. Harrod. 2005. A human T-cell lymphotropic virus type 1 enhancer of Myc-transforming potential stabilizes Myc-TIP60 transcriptional interactions. Mol. Cell. Biol. 256178-6198. - PMC - PubMed
Publication types
MeSH terms
Substances
Grants and funding
LinkOut - more resources
Full Text Sources
Miscellaneous

