Comparative Study
. 2009 Feb 4;29(5):1267-76.
doi: 10.1523/JNEUROSCI.2942-08.2009.

Control and function of the homeostatic sleep response by adenosine A1 receptors

Affiliations
Comparative Study

Control and function of the homeostatic sleep response by adenosine A1 receptors

Theresa E Bjorness et al. J Neurosci. .

Abstract

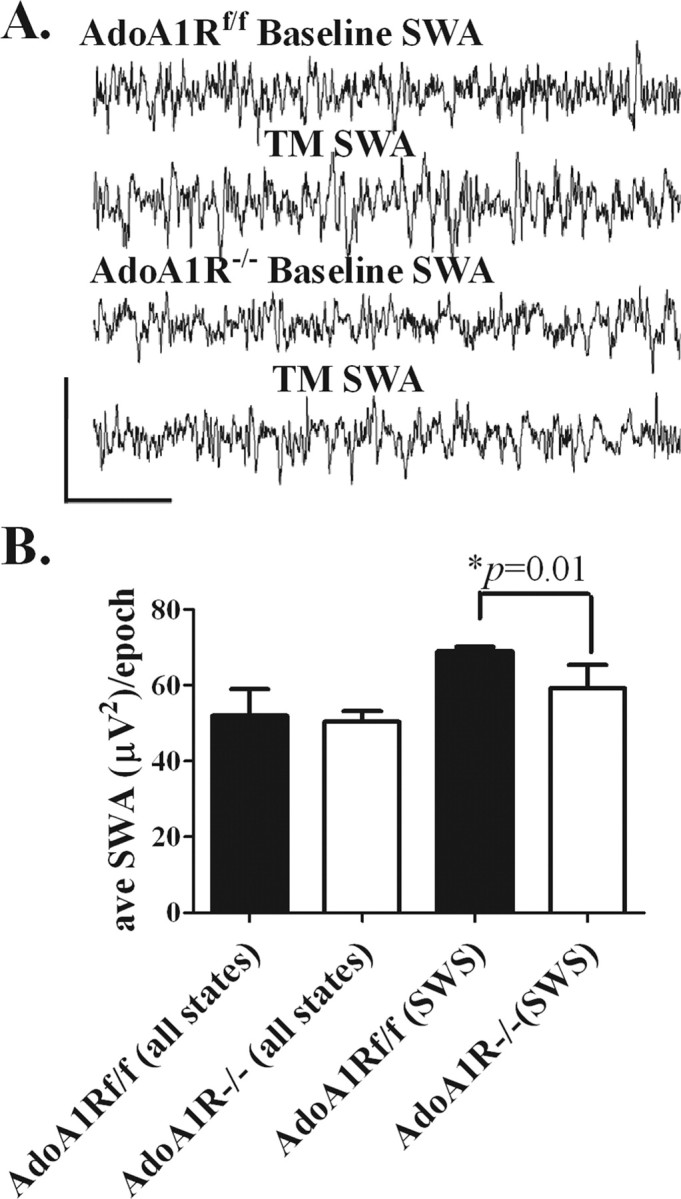
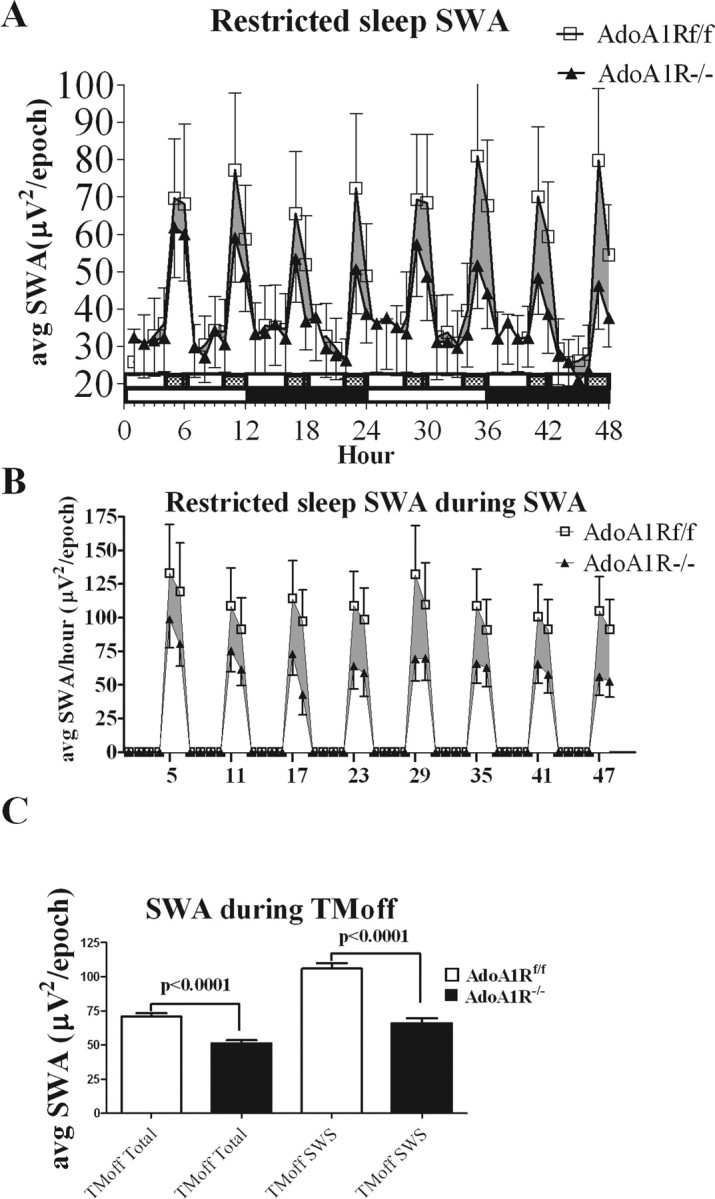
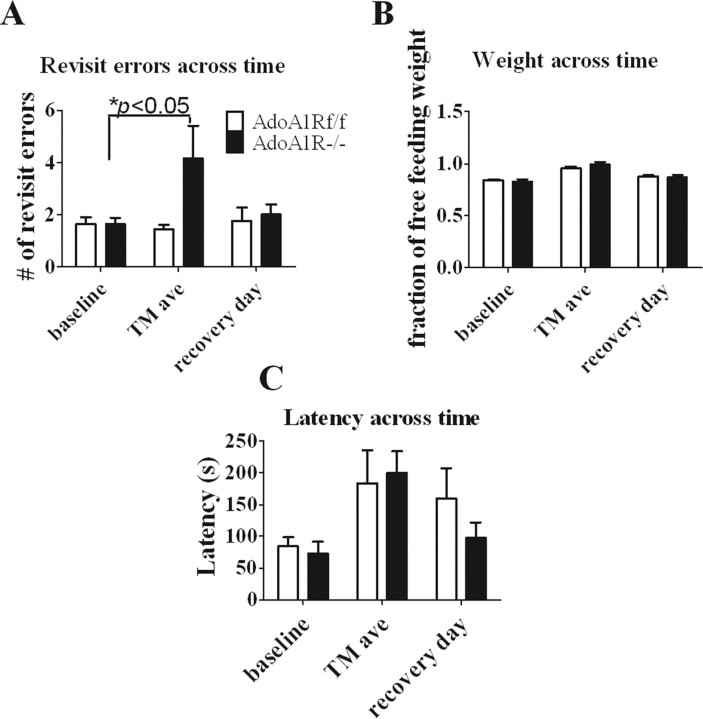
During sleep, the mammalian CNS undergoes widespread, synchronized slow-wave activity (SWA) that directly varies with previous waking duration (Borbély, 1982; Dijk et al., 1990). When sleep is restricted, an enhanced SWA response follows in the next sleep period. The enhancement of SWA is associated with improved cognitive performance (Huber et al., 2004), but it is unclear either how the SWA is enhanced or whether SWA is needed to maintain normal cognitive performance. A conditional, CNS knock-out of the adenosine receptor, AdoA(1)R gene, shows selective attenuation of the SWA rebound response to restricted sleep, but sleep duration is not affected. During sleep restriction, wild phenotype animals express a rebound SWA response and maintain cognitive performance in a working memory task. However, the knock-out animals not only show a reduced rebound SWA response but they also fail to maintain normal cognitive function, although this function is normal when sleep is not restricted. Thus, AdoA(1)R activation is needed for normal rebound SWA, and when the SWA rebound is reduced, there is a failure to maintain working memory function, suggesting a functional role for SWA homeostasis.


Figures

Figure 1.
Figure 1.
A conditional deletion of the AdoA1R gene. Cre expression in 6- to 8-week-old mice under the control of a CaMKII promoter induces recombination of floxed genes in both the forebrain and the hindbrain. First column, The reporter mouse ROSA26 was used to demonstrate Cre expression and therefore the location and spread of AdoA1R knock-out. Sections from an offspring of a ROSA26 reporter mouse crossed with a CaMKII-Cre mouse were stained with XGal (βGal stain) and neutral red (counterstain). ROSA26 mice express βGal wherever the transgene (in this case Cre) is expressed. The XGal stain is dark blue and apparent in both the cortex and the hindbrain tegmentum, and to a lesser extent in the thalamus. Second column, Autoradiographic label of mRNA message for AdoA1R is from comparable sections in Cre-negative AdoA1Rf/f mice. Third column, Cre-positive AdoA1R−/− mice probed for mRNA message for AdoA1R. AdoA1R message is reduced in regions that both are Cre+ (first column) and show AdoA1R message (compare second and third columns). Together, these results suggest that AdoA1R expression is reduced in most areas of the brain in the AdoA1R−/− mice.
Figure 2.
Figure 2.
Sleep restriction apparatus. To sleep restrict mice, a 6 h cycle composed of 4 h of enforced waking and 2 h of uncontrolled behavioral state (4 h on and 2 h off) was used. Mice were placed in a Plexiglas cage with no bottom, ¼ inch above a treadmill that moved at a speed of 3 cm/s. Food and water tubes were placed in each cage.
Figure 3.
Figure 3.
The AdoA1R-inducible gene deletion did not significantly affect the relative time spent in waking or SWS but does affect SWA across states and within SWS. A, Percentage time in waking and SWS (sleep time) is shown for AdoA1R−/− and AdoA1Rf/f mice analyzed for four 2 h periods (equivalent to TM-off periods of sleep restriction days) under baseline conditions. B, SWA for all states (total) and during waking and (C on right) during SWS was analyzed for the same four 2 h periods during baseline conditions. C, The loss of the AdoA1R gene resulted in significantly less average SWA power during SWS and in an attenuated increase in SWA power from waking to the SWS state. This attenuation is attributable primarily to decreased SWA during SWS in the AdoA1R−/− mutants. Error bars indicate SEM.
Figure 4.
Figure 4.
SWS EEG power distribution by genotype. Power distribution (calculated as a percentage of total EEG power for each 1.0 Hz bin) in the frequency range from 0.5 to 15 Hz during SWS did not significantly differ between AdoA1Rf/f and AdoA1R−/− mice (n = 5 per genotype). Thus, although AdoA1R−/− animals show decreased SWA in the 3.0–4.5 Hz band, this frequency range (3.0–4.0, 4.0–5.0 Hz) makes up the same relative amount of the total power during SWS. Error bars indicate SEM.
Figure 5.
Figure 5.
SWA response to 4 h of sleep deprivation. The magnitude of SWA during SWS, assessed for 2 h after 4 h of sleep deprivation, was less in AdoA1R−/− mice. A, The top two lines show an EEG trace from an AdoA1Rf/f mouse during SWS under uncontrolled sleep (baseline) and after sleep deprivation (TM) conditions. The bottom two lines show a similar set of EEG traces from an AdoA1R−/− mouse. Calibration: 300 μV, 2.2 s. B, When SWA was calculated for all states, there was no difference between genotypes (left). However, AdoA1R−/− showed significantly less SWS-specific SWA (right). The difference in SWA between genotypes during SWS can be seen in the raw data. Error bars indicate SEM.
Figure 6.
Figure 6.
SWA during chronic sleep restriction. The enhancement of synchronized SWA after each 4 h enforced-waking period is markedly attenuated in AdoA1R−/− mice compared with the AdoA1Rf/f littermates. A, A graph is shown of the SWA power/10 s epoch (y-axis) averaged over each hour of the 48 h spent of the treadmill (x-axis) from data pooled from AdoA1R−/− (▴; n = 5) and AdoA1Rf/f (□; n = 5) mice. The slow-moving treadmill was on for 4 h (indicated by open 4 h horizontal bar) and off for 2 h (filled 2 h bar) for repeating 6 h cycles. Mice were maintained on a 12 h light (open 12 h horizontal bar)/12 h dark (filled 12 h bar) schedule. Eight cycles were completed in the 48 h experiment, and during the 2 h treadmill-off phase, the SWA enhancement by the AdoA1R−/− mice was consistently attenuated (shaded region indicates the power difference) compared with the AdoA1Rf/f genotype. B, Mice were scored for behavioral state, and average SWA power only during SWS was plotted for each of the 48 h of the experiment on the treadmill. C, The averaged SWA power/epoch for all of the treadmill-off phases showed a significant difference between genotypes, indicating a reduced SWA response to the 4 h waking period (left two bars). The largest difference in SWA power was observed during SWS during the TM off phase (right two bars). Error bars indicate SEM.
Figure 7.
Figure 7.
Percentage change in SWA within and between conditions. Left bars (white), During the 48 h restricted-sleep condition, AdoA1R−/− showed a reduced percentage increase in SWA from enforced waking (during the TM-on phase) to SWS (during the TM-off phase). Right bars (gray), The increase in SWA from waking to SWS state in the restricted-sleep condition is greater than the increase in SWA from waking to SWS in baseline condition and this is quantified as percentage change in SWA (y-axis). This additional increase during restricted sleep is significantly greater for the AdoA1Rf/f mice compared with the AdoA1R−/− mice. Error bars indicate SEM.
Figure 8.
Figure 8.
SWA-dependent deficit in working memory performance. Sleep restriction reduces working memory capacity in animals with conditional loss of AdoA1R gene expression, but it has no effect on those with intact AdoA1R expression. A, Pooled data for each genotype during baseline and sleep restriction (TM) conditions showed a performance deficit (increase in revisit errors) for AdoA1R−/− animals, but no deficit for AdoA1Rf/f animals. The deficit was reversed after a 1 d return to baseline sleeping conditions (recovery). B, C, There was no difference in the weight (B) or the time to task completion (C) between groups, suggesting that there was no difference in motivation or in sensory/motor ability to perform the task. Error bars indicate SEM.
Figure 9.
Figure 9.
Sleep restriction did not affect acquisition of a hippocampal-dependent appetitive, paired associates learning task used to assess episodic memory. Mice learned that one of two odor cues was rewarded in one context, and that in another context the reward assignment was reversed. After training, acquisition of a new odor/context pair was then tested during 5 d of the 4 h TM-on, 2 h TM-off sleep restriction condition. There was no difference in performance (percentage of correct trials) between groups (white/black bars); however, both genotypes showed significant improvement across days (gray cross-hatched bars). Error bars indicate SEM.

References

    1. Amzica F, Steriade M. Electrophysiological correlates of sleep delta waves. Electroencephalogr Clin Neurophysiol. 1998;107:69–83. - PubMed
    1. Arrigoni E, Rainnie DG, McCarley RW, Greene RW. Adenosine-mediated presynaptic modulation of glutamatergic transmission in the laterodorsal tegmentum. J Neurosci. 2001;21:1076–1085. - PMC - PubMed
    1. Arrigoni E, Crocker AJ, Saper CB, Greene RW, Scammell TE. Deletion of presynaptic adenosine A1 receptors impairs the recovery of synaptic transmission after hypoxia. Neuroscience. 2005;132:575–580. - PMC - PubMed
    1. Benington JH, Heller HC. Restoration of brain energy metabolism as the function of sleep. Prog Neurobiol. 1995;45:347–360. - PubMed
    1. Benington JH, Kodali SK, Heller HC. Stimulation of A1 adenosine receptors mimics the electroencephalographic effects of sleep deprivation. Brain Res. 1995;692:79–85. - PubMed

Publication types

MeSH terms

Substances