Comparative Study
. 2009 Feb 4;29(5):1300-11.
doi: 10.1523/JNEUROSCI.5446-08.2009.

Random walk behavior of migrating cortical interneurons in the marginal zone: time-lapse analysis in flat-mount cortex

Affiliations
Comparative Study

Random walk behavior of migrating cortical interneurons in the marginal zone: time-lapse analysis in flat-mount cortex

Daisuke H Tanaka et al. J Neurosci. .

Abstract

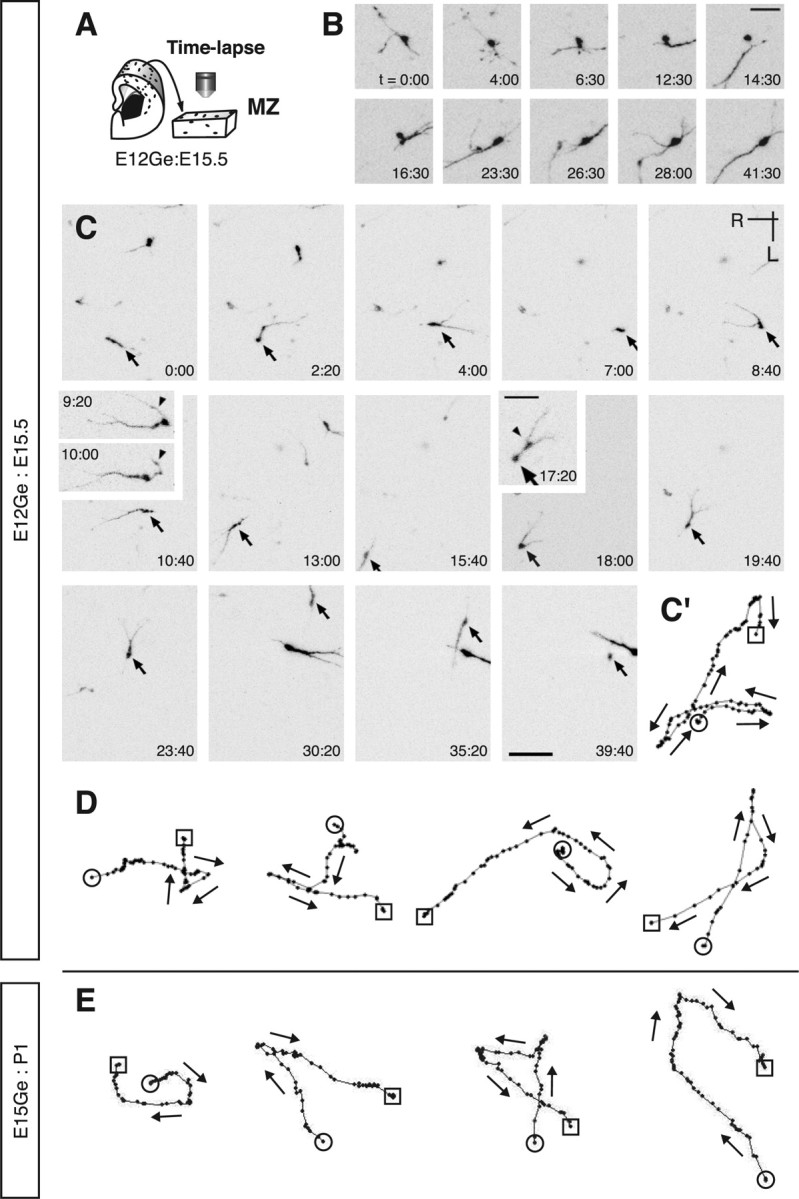
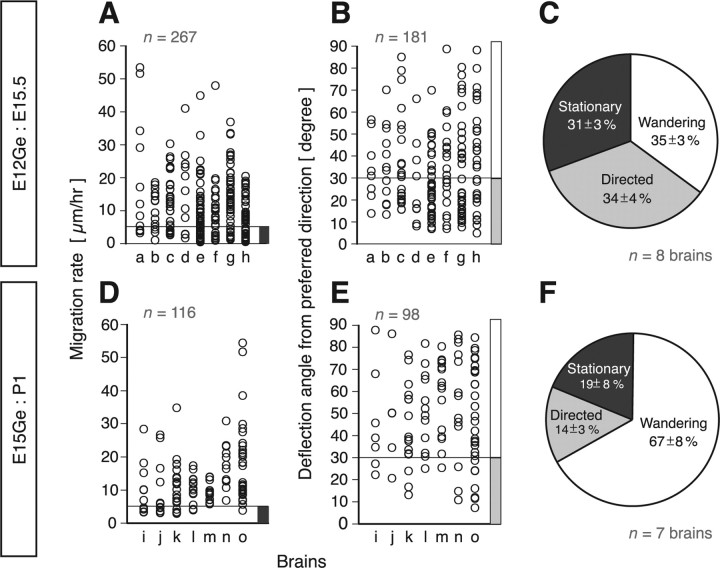
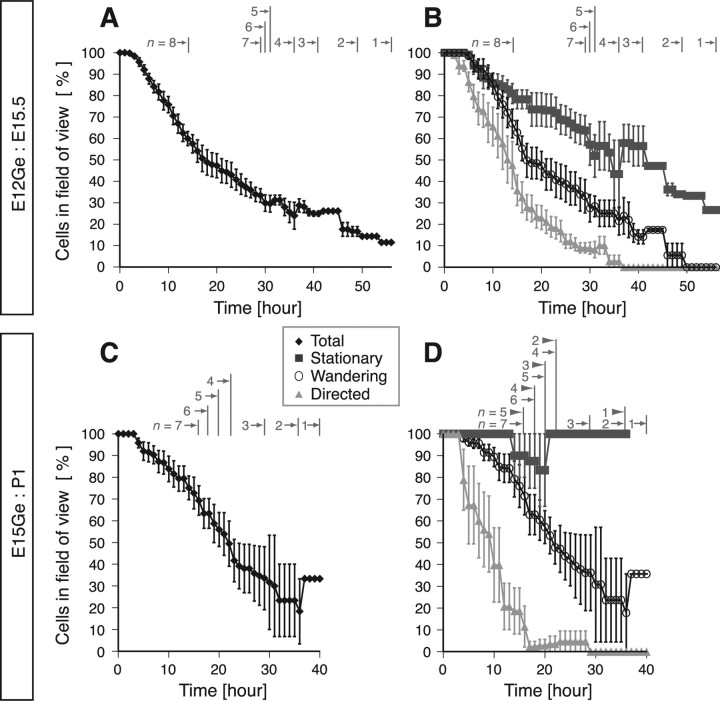
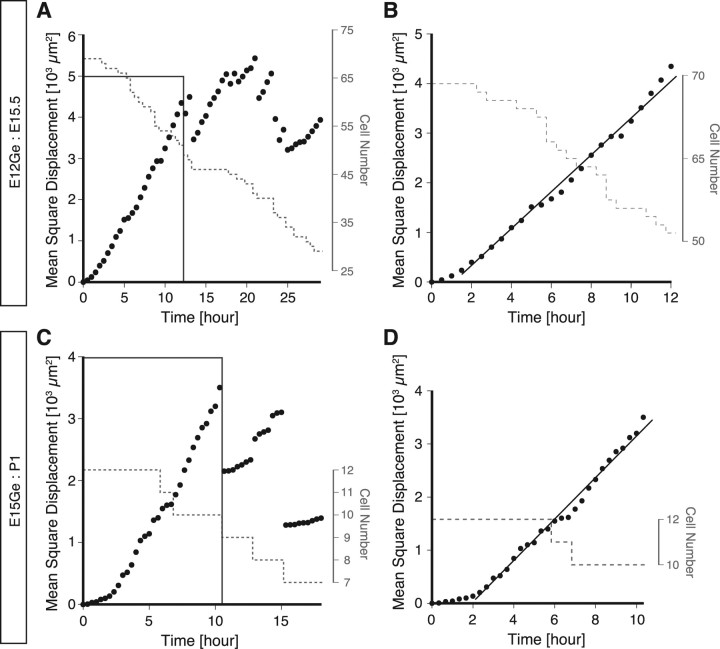
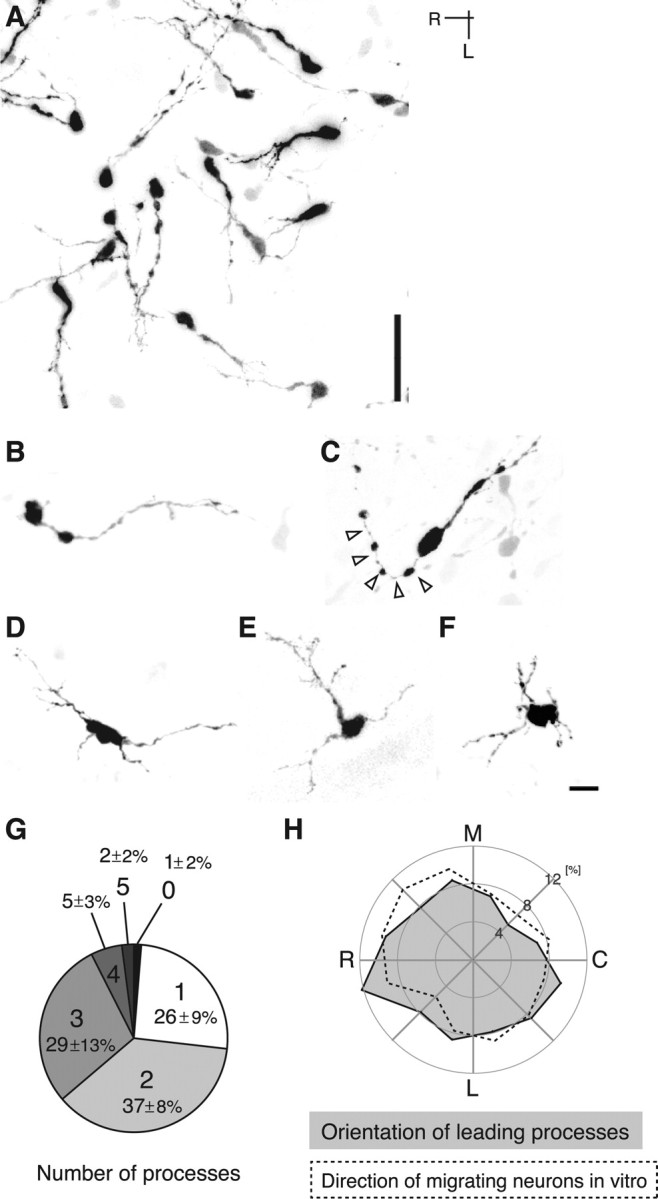
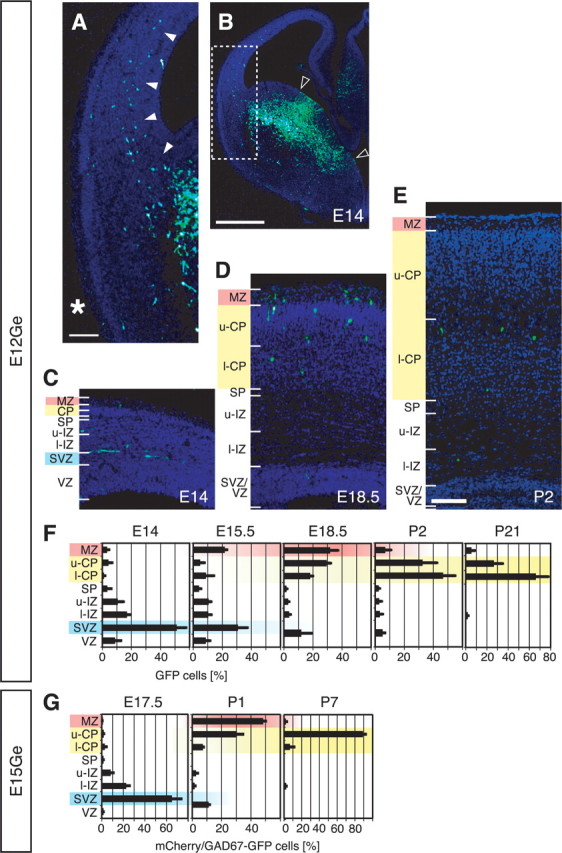
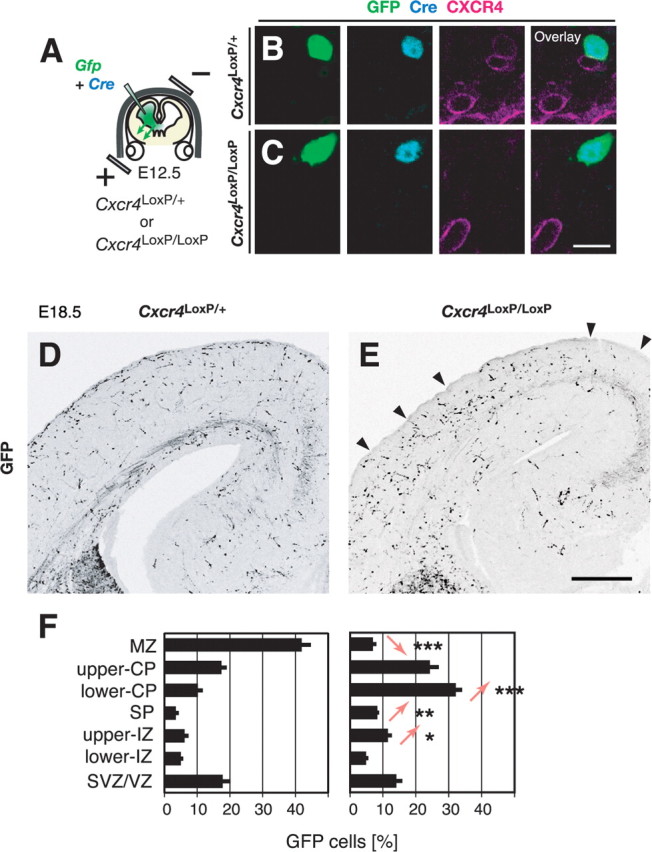
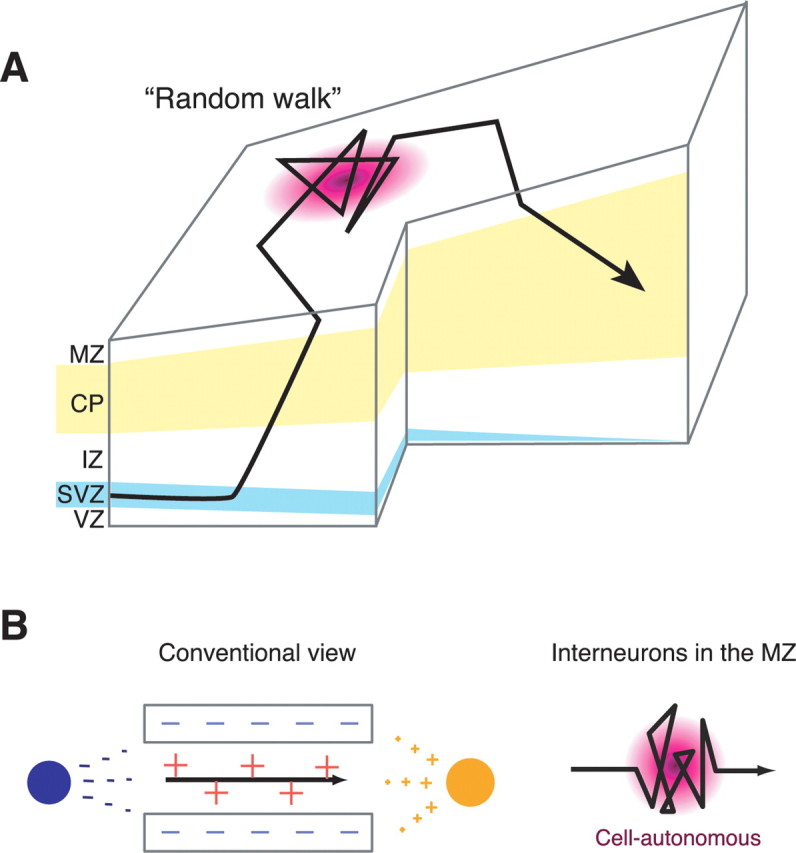
Migrating neurons are thought to travel from their origin near the ventricle to distant territories along stereotypical pathways by detecting environmental cues in the extracellular milieu. Here, we report a novel mode of neuronal migration that challenges this view. We performed long-term, time-lapse imaging of medial ganglionic eminence (MGE)-derived cortical interneurons tangentially migrating in the marginal zone (MZ) in flat-mount cortices. We find that they exhibit a diverse range of behaviors in terms of the rate and direction of migration. Curiously, a predominant population of these neurons repeatedly changes its direction of migration in an unpredictable manner. Trajectories of migration vary from one neuron to another. The migration of individual cells lasts for long periods, sometimes up to 2 d. Theoretical analyses reveal that these behaviors can be modeled by a random walk. Furthermore, MZ cells migrate from the cortical subventricular zone to the cortical plate, transiently accumulating in the MZ. These results suggest that MGE-derived cortical interneurons, once arriving at the MZ, are released from regulation by guidance cues and initiate random walk movement, which potentially contributes to their dispersion throughout the cortex.


Figures

Figure 1.
Figure 1.
Interneurons exhibit a wide variety of behaviors in the MZ. A, Schematic of time-lapse imaging in a flat-mount cortex from E12Ge:E15.5 brains. B, Time-lapse sequence of a GFP cell showing stationary behavior. Although the soma was stationary, the processes dynamically extended and retracted during the observation period. The numbers in the bottom right corners indicate time. C, Time-lapse sequence of a GFP cell showing wandering behavior. Arrows indicate the same neuron at different time points. In frames 9:20 and 10:00, arrowheads indicates a leading process transforming into a trailing process. In frame 17:20, the arrow or arrowhead indicates a soma or a swelling, respectively. The numbers in the bottom right or top left corners indicate time. C′, Track of the cell indicated by the arrows in C. Each black dot illustrates the cell position plotted at 20 min intervals. The circle or square illustrates the initial or final position, respectively. Arrows indicate the direction of migration. D, E, Examples of cell tracks wandering in E12Ge:E15.5 (D) or E15Ge:P1 (E) cortices. Each black dot illustrates the cell position plotted at 30 min intervals. The circle or square illustrates the initial or final position, respectively. Arrows indicate the direction of migration. R, Rostral; L, lateral. Scale bars: B, 30 μm; C–E, 50 μm; C (insets), 25 μm.
Figure 2.
Figure 2.
Major population of MZ interneurons are wandering cells. Data are from DsRed cells in E12Ge:E15.5 GAD67-GFP cortices (n = 1; a in the abscissa of A and B) and GFP cells in E12Ge:E15.5 wild-type cortices (n = 7; b–h in the abscissa of A and B) (A–C) or mCherry cells in E15Ge:P1 GAD67-GFP cortices (D–F). A, D, The rate of migration of individual cells in E12Ge:E15.5 (n = 267 cells, 8 brains) (A) and E15Ge:P1 (n = 116 cells, 7 brains) (D) cortices. The dark gray bar indicates the range of cells categorized as stationary cells. B, E, The deflection angle of individual migrating cells from their preferred directions in E12Ge:E15.5 (n = 181 cells, 8 brains) (B) and E15Ge:P1 (n = 98 cells, 7 brains) (E) cortices. The white or light gray bar indicates the range of cells categorized as wandering or directed cells, respectively. C, F, The proportion of cells showing a stationary, directed, or wandering behavior in E12Ge:E15.5 (n = 267 cells, 8 brains) (C) and E15Ge:P1 (n = 116 cells, 7 brains) (F) cortices (average ± SEM).
Figure 3.
Figure 3.
Many interneurons stay in the MZ for a prolonged period of time. The time course of the proportion of labeled cells remaining in the imaging field during time-lapse imaging in E12Ge:E15.5 GAD67-GFP (n = 1) and E12Ge:E15.5 wild-type (n = 7) cortices (A, B) or E15Ge:P1 GAD67-GFP cortices (C, D) (average ± SEM) is shown. A, C, The data from all labeled cells. Gray numbers with arrows indicate the number of brains examined at a certain period of time (e.g., in A, seven brains were examined between 15 and 29 h from the start of imaging). The total number of cells analyzed was 267 and 116 in E12Ge:E15.5 and E15Ge:P1 cortices, respectively. B, D, Dark gray squares, white circles, or light gray triangles indicate the data from cells showing stationary, wandering, or directed behavior, respectively. Because two cortices contained no stationary cells among the seven E15Ge:P1 cortices analyzed, the number of brains examined for the analysis of stationary cells at a certain period of time is indicated by the gray numbers with closed arrowheads in D. The total number of cells analyzed was 99 and 18 for stationary cells, 86 and 80 for wandering cells, and 88 and 18 for directed cells in E12Ge:E15.5 and E15Ge:P1 cortices, respectively.
Figure 4.
Figure 4.
MZ interneurons move in a diffusion mode. A, C, Representative data showing the plots of the MSD as a function of time in an E12Ge:E15.5 (n = 75 cells) (A) and in an E15:P1 (n = 12 cells) (C) cortex. B, Enlarged view of the box in A. The approximate linearity was found during time between 2 and 12 h (black line) despite the cell number decrease (gray dashed line). D, Enlarged view of the box in C. The approximate linearity was found during time between 2.5 and 10 h (black line) despite the cell number decrease (gray dashed line). Similar results were obtained from six E12Ge:E15 brains (n = 252 cells in total) and seven E15:P1 brains (n = 116 cells in total). These results indicate that the behavior of individual neurons can be modeled by a diffusion mode, and it is to be noted that a population of cells composed of neurons each with a directed pattern of migration cannot be explained by the diffusion mode. In B and D, the black lines are hand drawn to guide the eye. The MSD show suddenly drops after ∼12 h of imaging. This is likely attributable to the disappearance of some quickly moving cells from the imaging field. Indeed, we found that these drops were always accompanied with the exclusion of high MSD cells from the analysis (Tanaka, M. Yanagida, and Murakami, unpublished observation).
Figure 5.
Figure 5.
Morphology and orientation of GFP cells in the MZ in fixed cortices. A–F, GFP cell morphology in the MZ in E12Ge:E15.5 (A, B, D, E), E11.5Ge:E17.5 (C), or E12Ge:E17.5 (F) cortices. A, GFP cells are oriented in many directions. B, A cell with distinct leading process reminiscent of a directed cell. C, This cell also has a distinct leading process, but its trailing process is curved (arrowheads), a morphology similar to that of wandering cells in the course of turning (Fig. 1C, frame 10:00). D–F, These cells show a multipolar morphology similar to stationary cells (compare D–F, Fig. 1B, frames 28:00 and 4:00, respectively). G, The proportion of GFP cells with a different number of primary processes in fixed E12Ge:E15.5 cortices (n = 175 cells, 6 brains) (average ± SEM). Digits with large letters, 0–5, indicate the number of processes. Whereas a majority (∼60%) of GFP cells extended one or two processes, one-third of them extended more than three processes. Note that the proportion of cells with one or two processes is comparable with that of the sum of directed and wandering cells (Fig. 2C) and that of the cells with more than two processes is comparable with that of stationary cells. H, Quantification of the orientation of leading processes of GFP cells in fixed E12Ge:E15.5 cortices (gray region; n = 115 cells, 6 brains). A similar polar plot of GFP cells migrating in E12Ge:E15.5 cortices in vitro was superimposed for comparison (dashed line; n = 181 cells, 8 brains). Note the similarity between the two results. The leading processes of GFP cells that extend one or two processes were subjected to the analysis. The leading process was defined as the thickest process extending from a GFP cell. The orientation of leading processes was defined as that of a line connecting the cell body center and the base of the leading process. Medial (M) was defined as 0°, and rostral (R) was defined as 90°. The horizontal plane was then subdivided into 12 sectors, and the proportion of cells with an orientation that falls into each sector was plotted as a polar diagram. For the analysis of the direction of migrating cells in vitro, their preferred migrating cells was defined as those migrating at rate of >5 μm/h. For the analysis of directionality, the horizontal plane was subdivided into 12 sectors, and the proportion of cells with a preferred direction that falls into each sector was scored. The preferred direction of migrating GFP cells (see Materials and Methods) was plotted in the same way as above. L, Lateral.; C, caudal. Scale bars: A, 40 μm; B–F, 10 μm.
Figure 6.
Figure 6.
Transient accumulation of interneurons in the MZ. A, Enlarged view of the boxed region in B. GFP cells entered the cortex via the SVZ (arrowheads), not the MZ (asterisk). All sections were counterstained with DAPI (blue) to determine the cortical zones. B, The distribution of GFP cells in the ipsilateral E12Ge:E14 forebrain. The region sandwiched between the open arrowheads is the presumptive region where Gfp plasmids were extensively transfected. C–E, The distribution of GFP cells in E12Ge:E14 (C), E12Ge:E18.5 (D), and E12Ge:P2 (E) coronal sections. Dorsomedial is toward the right. F, Quantification of the zonal distribution of labeled cells in E12Ge:E14 (n = 273 cells, 49 sections, 4 brains), E12Ge:E15.5 (n = 222 cells, 31 sections, 3 brains), E12Ge:E18.5 (n = 659 cells, 23 sections, 3 brains), E12Ge:P2 (n = 174 cells, 33 sections, 3 brains), and E12Ge:P21 (n = 544 cells, 178 sections, 5 brains) cortices (average ± SEM). The abscissa indicates the proportion of labeled cells in each cortical zone. At E14–E15.5, the cortical wall was subdivided into eight zones: MZ, upper CP (u-CP), lower CP (l-CP), subplate (SP), upper intermediate zone (u-IZ), lower IZ (l-IZ), SVZ, and VZ. Because the border between the IZ and SVZ was obscure, the SVZ was defined as a zone with one-quarter thickness of the VZ. The SP was defined as a monolayer between the CP and the IZ. At both E18.5 and P2, SVZ and VZ were unified as one zone, SVZ/VZ. At P21, SP, IZ and SVZ/VZ were unified as one zone, white matter, whereas layers 1, 2–4, and 5/6 were represented as MZ, u-CP, and l-CP in the graph, respectively. These categories were made to simplify comparisons. G, Same as F, but for mCherry/GAD67-GFP double-labeled cells in E15Ge:E17.5 (n = 250 cells, 28 sections, 3 brains), E15Ge:P1 (n = 140 cells, 27 sections, 3 brains), and E15Ge:P7 (n = 164 cells, 24 sections, 3 brains) GAD67-GFP cortices. Scale bars: A, C–E, 100 μm; B, 500 μm.
Figure 7.
Figure 7.
CXCR4 expressed in migrating interneurons labeled by GE-directed electroporation cell-autonomously functions for their accumulation in the MZ. A, Experimental paradigm used to examine the role of CXCR4 in migrating interneurons. B, C, CXCR4 expression in a GFP cell in the coronal section from Cxcr4loxP/+ (B) or Cxcr4loxP/loxP (C) cortices 6 d after electroporation (E18.5). The expression of CXCR4 (magenta) in a GFP-labeled (green), Cre-expressing (light blue) interneuron is reduced in Cxcr4loxP/loxP cortices (C) compared with that in Cxcr4loxP/+ cortices (B). D, E, The distribution of GFP cells 6 d after electroporation (E18.5) in Cxcr4loxP/+ (D) or Cxcr4loxP/loxP (E) cortices. Arrowheads indicate the MZ where few GFP cells distributed. Medial is toward the right. F, Quantitative analysis of the distribution of GFP cells within the cortex 6 d after electroporation (E18.5) in Cxcr4loxP/+ (left; n = 767 cells, 6 brains) or Cxcr4loxP/loxP (right; n = 1251 cells, 11 brains) cortices. The abscissa indicates the proportion of GFP cells in each cortical zone. Statistical analysis was done between genotypes in each zone. ***p = 0.0009; **p = 0.003; *p < 0.016; Mann–Whitney U test. Scale bars: B, C, 10 μm; D, E, 300 μm. SP, Subplate; IZ, intermediate zone.
Figure 8.
Figure 8.
Models of intracortical migration pathways and underlying mechanisms for MGE-derived interneurons. A, A model of the migratory pathway for interneurons within the developing cerebral cortex. Interneurons derived from the MGE initially enter the CP from the SVZ, pass through it, reach the MZ, move in a random walk manner, and then migrate back to and remain in the CP. Some interneurons in the SVZ may exhibit ventricle-directed migration in the VZ (Nadarajah et al., 2002) before they migrate toward the MZ, which could not be detected in the present study. IZ, Intermediate zone. B, Models of migratory mechanisms for random walk behavior. A conventional view of neuronal migration argues neurons translocate from one point to another via stereotyped pathways (left). The direction of migration can be regulated by spatiotemporally regulating the expression of guidance cues (orange plus, chemoattractant; red plus, contact attractant; dark blue minus, chemorepellent; light blue minus, contact repellent) and by regulating the neurons' responses to these cues. In contrast, the migratory pathways observed here were diverse and unpredictable (right). These behaviors cannot be fully explained by the conventional model. Instead, it is likely regulated by guidance cue-independent, cell-autonomous mechanisms.

Comment in

Similar articles

Cited by

References

    1. Ang ES, Jr, Haydar TF, Gluncic V, Rakic P. Four-dimensional migratory coordinates of GABAergic interneurons in the developing mouse cortex. J Neurosci. 2003;23:5805–5815. - PMC - PubMed
    1. Ara T, Tokoyoda K, Sugiyama T, Egawa T, Kawabata K, Nagasawa T. Long-term hematopoietic stem cells require stromal cell-derived factor-1 for colonizing bone marrow during ontogeny. Immunity. 2003;19:257–267. - PubMed
    1. Berg HC. Random walks in biology. Princeton, NJ: Princeton UP; 1993.
    1. Bloch-Gallego E, Causeret F, Ezan F, Backer S, Hidalgo-Sanchez M. Development of precerebellar nuclei: instructive factors and intracellular mediators in neuronal migration, survival and axon pathfinding. Brain Res Brain Res Rev. 2005;49:253–266. - PubMed
    1. Borrell V, Marín O. Meninges control tangential migration of hem-derived Cajal-Retzius cells via CXCL12/CXCR4 signaling. Nat Neurosci. 2006;9:1284–1293. - PubMed

Publication types

MeSH terms

LinkOut - more resources