. 2009 Apr;296(4):R877-92.
doi: 10.1152/ajpregu.90568.2008. Epub 2009 Feb 4.

Appetitive and consummatory ingestive behaviors stimulated by PVH and perifornical area NPY injections

Affiliations

Appetitive and consummatory ingestive behaviors stimulated by PVH and perifornical area NPY injections

Megan J Dailey et al. Am J Physiol Regul Integr Comp Physiol. 2009 Apr.

Abstract

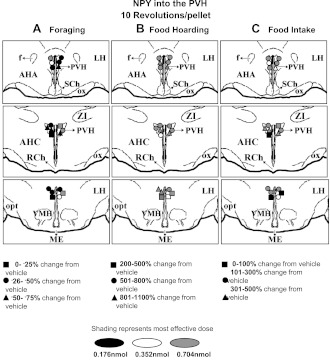
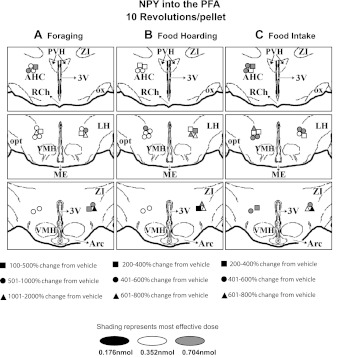
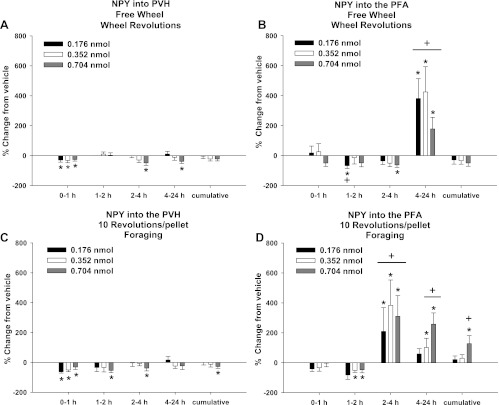
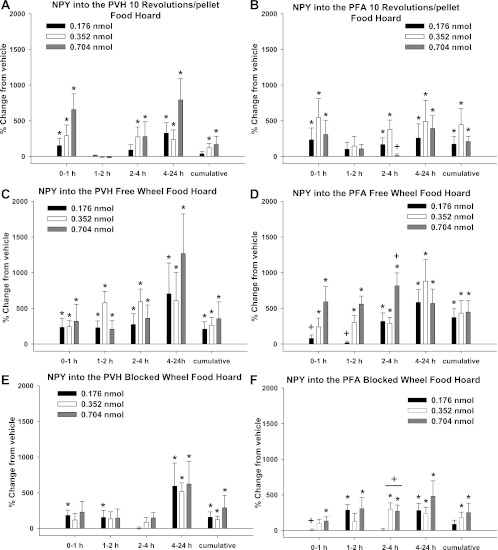
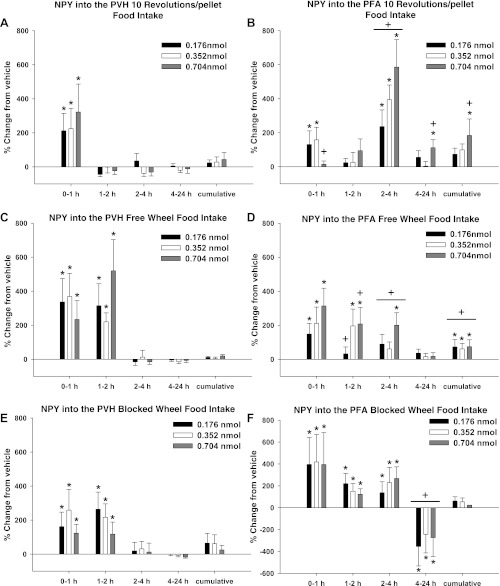
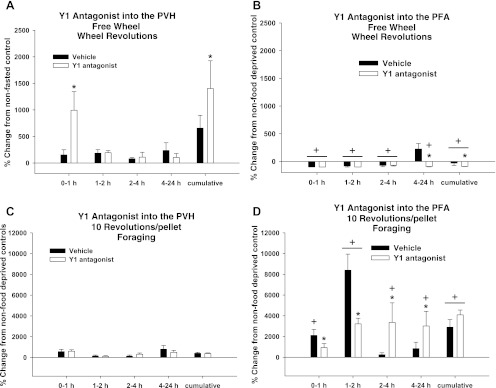
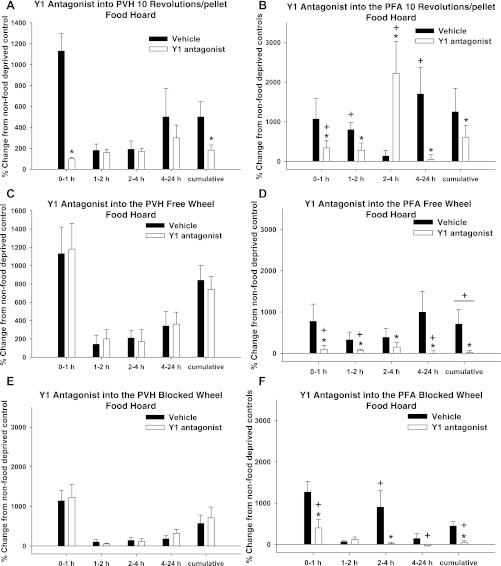
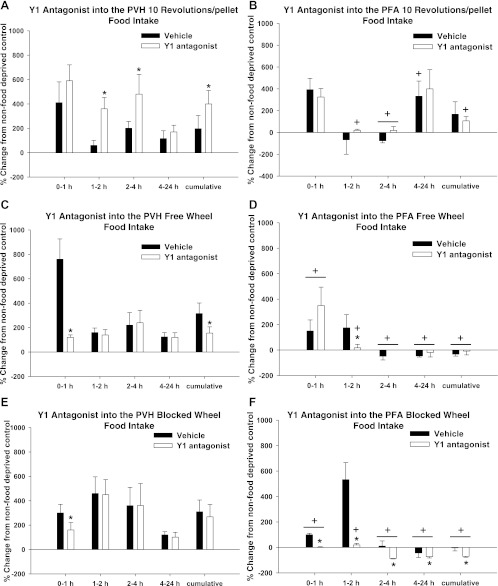
Food is acquired (obtained by foraging) and frequently stored (hoarded) across animal taxa, including humans, but the physiological mechanisms underlying these behaviors are virtually unknown. We found that peptides that stimulate food intake in rats stimulate food foraging and/or hoarding more than intake in Siberian hamsters. Neuropeptide Y (NPY) is a potent orexigenic peptide that increases food foraging and hoarding (appetitive behavior) and food intake (consummatory behavior). Given that NPY injections into the hypothalamic paraventricular nucleus (PVH) or perifornical area (PFA) increase food intake by rats, it is possible that these injections may stimulate food foraging or hoarding by Siberian hamsters. We also tested whether antagonism of the NPY Y1 receptor (Y1-R), the agonism of which stimulates hoarding, would inhibit post-food-deprivation increases in foraging and hoarding. We injected one of three doses of NPY or vehicle into the PVH or PFA of animals housed in a simulated foraging-hoarding housing system and measured these behaviors at 1, 2, 4, and 24 h. A subset of animals was subsequently food deprived and then given PVH or PFA Y1-R antagonist microinjections before they were refed. NPY PVH microinjections decreased foraging but increased hoarding and food intake, whereas NPY PFA microinjections increased all three behaviors, but the greatest increase was in hoarding. Y1-R antagonist inhibited post-food-deprivation increases in hoarding when injected into the PVH and PFA and inhibited foraging when injected into the PFA. These results support the view that NPY is involved in appetitive and consummatory ingestive behaviors, but each may be controlled by different brain areas and/or NPY receptor subtypes.


Figures

Fig. 1.
Fig. 1.
Mapping of neuropeptide Y (NPY) hypothalamic paraventricular nucleus (PVH) injections for the 10 revolutions per pellet (10 Rev) group, with corresponding greatest increases/decreases in foraging (A), food hoarding (B), and food intake (C). AHC, anterior hypothalamus, central; LH, lateral hypothalamus; AHA, anterior hypothalamic area; RCh, retrochiasmatic area; SCh, suprachiasmatic area; VMH, ventromedial hypothalamus; ME, median eminence; f, fornix; opt, optic tract; ox, optic chiasm.
Fig. 2.
Fig. 2.
Mapping of NPY PFA injections for the 10 Rev group, with corresponding greatest increases/decreases in foraging (A), food hoarding (B), and food intake (C). Arc, arcuate nucleus.
Fig. 3.
Fig. 3.
Percent change from vehicle for each NPY dose in wheel revolutions for the free-wheel (FW) group and foraging for the 10 Rev group after injections of NPY into the PVH (A and C) and perifornical area (PFA; B and D). A: percent change in wheel revolutions after vehicle injections into the PVH for the FW group [absolute values: 294.8 ± 166.5 (0–1 h), 96.2 ± 49.3 (1–2 h), 473.3 ± 264.7 (2–4 h), 201.3 ± 105.7 (4–24 h), and 985.2 ± 544.8 (cumulative)]. B: percent change in wheel revolutions after vehicle injections into the PFA for the FW group [absolute values: 181.0 ± 65.4 (0–1 h), 134.1 ± 55.9 (1–2 h), 282.1 ± 99.7 (2–4 h), 730.4 ± 202.5 (0–24 h), and 1,326.9 ± 309.6 (cumulative)]. C: percent change in foraging after vehicle injections into the PVH for the 10 Rev group [absolute values: 480.4 ± 104.9 (0–1 h), 252.8 ± 79.4 (1–2 h), 631.8 ± 188.0 (2–4 h), 518.1 ± 125.9 (4–24 h), and 1,880.1 ± 382.3 (cumulative)]. D: percent change in foraging after vehicle injections into the PFA for the 10 Rev group [absolute values: 194.3 ± 75.4 (0–1 h), 119.33 ± 52.16 (1–2 h), 154.2 ± 109.5 (2–4 h), 173.7 ± 42.7 (0–24 h), and 640.4 ± 162.1 (cumulative)]. Values are means ± SE. *P < 0.05 vs. vehicle control. +P < 0.05 vs. PVH.
Fig. 4.
Fig. 4.
Percent change from vehicle for each NPY dose in food hoarding for the 10 Rev group, FW group, and blocked-wheel (BW) group after injections of NPY into the PVH (A, C, and E) and PFA (B, D, and F). A: percent change in food hoarding after vehicle injections into the PVH for the 10 Rev group [absolute values: 1.7 ± 0.7 (0–1 h), 1.5 ± 0.5 (1–2 h), 3.8 ± 2.1 (2–4 h), 7.2 ± 3.7 (4–24 h), and 15.1 ± 3.9 (cumulative)]. B: percent change in food hoarding after vehicle injections into the PFA for the 10 Rev group [absolute values: 1 ± 0 (0–1 h), 1 ± 0 (1–2 h), 1.7 ± 0.7 (2–4 h), 1.1 ± 0.1 (4–24 h), and 4.8 ± 0.7 (cumulative)]. C: percent change in food hoarding after vehicle injections into the PVH for the FW group [absolute values: 1.7 ± 0.7 (0–1 h), 1.6 ± 0.5 (1–2 h), 1.9 ± 0.9 (2–4 h), 9.4 ± 3.5 (4–24 h), and 15.5 ± 3.5 (cumulative)]. D: percent change in food hoarding after vehicle injections into the PFA for the FW group [absolute values: 1 ± 0 (0–1 h), 1.1 ± 0.1 (2 h), 2.4 ± 1.0 (4 h), 6.7 ± 3.1 (24 h), and 11.3 ± 3.1 (cumulative)]. E: percent change in food hoarding after vehicle injections into the PVH for the BW group [absolute values: 1.5 ± 0.3 (0–1 h), 1 ± 0 (1–2 h), 2.2 ± 0.5 (2–4 h), 8.2 ± 3.5 (4–24 h), and 13.8 ± 3.8 (cumulative)]. F: percent change in food hoarding after vehicle injections into the PFA for the BW group [absolute values: 1.5 ± 0.5 (0–1 h), 1 ± 0 (1–2 h), 2.9 ± 0.9 (2–4 h), 9.9 ± 3.1 (4–24 h), and 15.2 ± 3.1 (cumulative)]. Values are means ± SE. *P < 0.05 vs. vehicle control. +P < 0.05 vs. PVH.
Fig. 5.
Fig. 5.
Percent change from vehicle for each NPY dose in food intake for 10 Rev, FW, and BW groups after injections of NPY into the PVH (A, C, and E) and PFA (B, D, and F). A: percent change in food intake after vehicle injections into the PVH for the 10 Rev group [absolute values: 7.3 ± 2.9 (0–1 h), 6.2 ± 3.4 (1–2 h), 14.3 ± 6.1 (2–4 h), 34.4 ± 5.7 (4–24 h), and 63.2 ± 16.5 (cumulative)]. B: percent change in food intake after vehicle injections into the PFA for the 10 Rev group [absolute values: 2.3 ± 0.9 (0–1 h), 1.8 ± 0.8 (1–2 h), 1.6 ± 0.6 (2–4 h), 14.89 ± 3.3 (4–24 h), and 640.4 ± 162.1 (cumulative)]. C: percent change in food intake after vehicle injections into the PVH for the FW group [absolute values: 8.6 ± 0.8 (0–1 h), 1.3 ± 0.2 (1–2 h), 5.8 ± 0.9 (2–4 h), 36.2 ± 1.9 (4–24 h), and 47.9 ± 2.0 (cumulative)]. D: percent change in food intake after vehicle injections into the PFA for the FW group [absolute values: 1.4 ± 0.3 (0–1 h), 2 ± 0.5 (1–2 h), 3.8 ± 1.5 (2–4 h), 22.9 ± 3.6 (4–24 h), and 30 ± 3.03 (cumulative)]. E: percent change in food intake after vehicle injections into the PVH for the BW group [absolute values: 3.7 ± 0.7 (0–1 h), 1.8 ± 0.5 (1–2 h), 6.73 ± 1.3 (2–4 h), 33.18 ± 3.6 (4–24 h), and 46.3 ± 4.6 (cumulative)]. F: percent change in food intake after vehicle injections into the PFA for the BW group [absolute values are as follows: 1.5 ± 0.5 (0–1 h), 1 ± 0 (2–4 h), 4.5 ± 1.3 (2–4 h), 28.6 ± 3.9 (4–24 h), and 35.7 ± 4.1 (cumulative)]. Values are means ± SE. *P < 0.05 vs. vehicle control. +P < 0.05 vs. PVH.
Fig. 6.
Fig. 6.
Percent change from non-food-deprived hamsters in wheel revolutions for the FW group and foraging for the 10 Rev group after injections of vehicle or Y1 antagonist into the PVH (A and C) and PFA (B and D). A: percent change in wheel revolutions of non-food-deprived hamsters of the FW group injected with vehicle [absolute values: 64 ± 21.7 (0–1 h), 0 ± 0 (1–2 h), 140 ± 35.2 (2–4 h), 237 ± 0.7 (4–24 h), and 441 ± 5 (cumulative)] and Y1 antagonist [absolute values: 74.8 ± 14.9 (0–1 h), 4 ± 3.5 (1–2 h), 162 ± 62.4 (2–4 h), 104.2 ± 74.4 (4–24 h), and 345 ± 144.8 (cumulative)] into the PVH. B: percent change in wheel revolutions of non-food-deprived hamsters of the FW group injected with vehicle [absolute values: 276.5 ± 21.5 (0–1 h), 105 ± 12 (1–2 h), 359 ± 32.7 (2–4 h), 77 ± 6.2 (4–24 h), and 817.5 ± 129.5 (cumulative)] and Y1 antagonist [absolute values: 267.7 ± 59.2 (0–1 h), 152.3 ± 45.7 (1–2 h), 291.7 ± 29.2 (2–4 h), 261.3 ± 60.8 (4–24 h), and 973 ± 96.4 (cumulative)] into the PFA. C: percent change in foraging of non-food-deprived hamsters of the 10 Rev group injected with vehicle [absolute values: 63 ± 12.6 (0–1 h), 1 ± 0 (1–2 h), 140 ± 72.9 (2–4 h), 153.3 ± 58.0 (4–24 h), and 357.0 ± 77.8 (cumulative)] and Y1 antagonist [absolute values: 50 ± 9.2 (0–1 h), 1 ± 0 (1–2 h), 70 ± 13.8 (2–4 h), 172 ± 59.6 (4–24 h), and 293.9 ± 59.1 (cumulative)] into the PVH. D: percent change in foraging of non-food-deprived hamsters of the 10 Rev group injected with vehicle [absolute values: 10.5 ± 9.5 (0–1 h), 1 ± 0 (1–2 h), 27 ± 13.5 (2–4 h), 129.5 ± 64.5 (4–24 h), and 267 ± 8.7 (cumulative)] and Y1 antagonist [absolute values: 30 ± 8.5 (0–1 h), 1 ± 0 (1–2 h), 15 ± 1 (2–4 h), 104.3 ± 23.9 (4–24 h) and 150.7 ± 17.3 (cumulative)] into the PFA. Values are means ± SE. *P < 0.05 vs. non-food-deprived hamsters. +P < 0.05 vs. PVH.
Fig. 7.
Fig. 7.
Percent change from non-food-deprived hamsters in food hoarding for 10 Rev, FW, and BW groups after injection of vehicle or Y1 antagonist into the PVH (A, C, and E) and PFA (B, D, and F). A: percent change in food hoarding of non-food-deprived hamsters of the 10 Rev group injected with vehicle [absolute values: 4.0 ± 1.4 (0–1 h), 0 ± 0 (2 h), 2 ± 1.5 (2–4 h), 0 ± 0 (4–24 h), and 6 ± 3.1 (cumulative)] and Y1 antagonist [absolute values: 1.4 ± 0.4 (0–1 h), 0 ± 0 (1–2 h), 0 ± 0 (2–4 h), 2 ± 0.5 (4–24 h), and 3.4 ± 1.4 (cumulative)] into the PVH. B: percent change in food hoarding of non-food-deprived hamsters of the 10 Rev group injected with vehicle [absolute values: 0 ± 0 (0–1 h), 0 ± 0 (1–2 h), 3 ± 1.3 (2–4 h), 0 ± 0 (4–24 h), and 3 ± 1.3 (cumulative)] and Y1 antagonist [absolute values: 0 ± 0 (0–1 h), 0 ± 0 (1–2 h), 0 ± 0 (2–4 h), 0 ± 0 (4–24 h), and 0 ± 0 (cumulative)] into the PFA. C: percent change in food hoarding of non-food-deprived hamsters of the FW group injected with vehicle [absolute values: 2 ± 1.3 (0–1 h), 0 ± 0 (1–2 h), 3 ± 2.3 (2–4 h), 2 ± 1.7 (4–24 h), and 7 ± 3.9 (cumulative)] and Y1 antagonist [absolute values: 1 ± 0.3 (0–1 h), 0 ± 0 (1–2 h), 4 ± 2.4 (2–4 h), 0 ± 0 (4–24 h), and 5 ± 3.2 (cumulative)] into the PVH. D: percent change in food hoarding of non-food-deprived hamsters of the FW group injected with vehicle [absolute values: 1 ± 0 (0–1 h), 1 ± 0.3 (1–2 h), 4 ± 3.2 (2–4 h), 5.5 ± 1.5 (4–24 h), and 11.5 ± 1.5 (cumulative)] and Y1 antagonist [absolute values: 1.7 ± 0.7 (0–1 h), 1 ± 0.3 (1–2 h), 1 ± 0 (2–4 h), 14.3 ± 3.3 (4–24 h), and 18 ± 3.1 (cumulative)] into the PFA. E: percent change in food hoarding of non-food-deprived hamsters of the BW group injected with vehicle [absolute values: 0 ± 0 (0–1 h), 1 ± 0.7 (1–2 h), 3 ± 2.3 (2–4 h), 1 ± 0.7 (4–24 h), and 5 ± 3.2 (cumulative)] and Y1 antagonist [absolute values: 0 ± 0.7 (0–1 h), 2 ± 1.3 (1–2 h), 2 ± 0.7 (2–4 h), 1 ± 0 (4–24 h), and 5 ± 1.7 (cumulative)] into the PVH. F: percent change in food hoarding of non-food-deprived hamsters of the BW group injected with vehicle [absolute values: 1 ± 0 (0–1 h), 1 ± 0.3 (1–2 h), 1 ± 0.7 (2–4 h), 3 ± 2.3 (4–24 h), and 6 ± 3.9 (cumulative)] and Y1 antagonist [absolute values: 1 ± 0.7 (0–1 h), 1 ± 0.7 (1–2 h), 3 ± 2.3 (2–4 h), 4 ± 1.5 (4–24 h), and 9 ± 2.9 (cumulative)] into the PFA. Values are means ± SE. *P < 0.05 vs. non-food-deprived hamsters. +P < 0.05 vs. PVH.
Fig. 8.
Fig. 8.
Percent change from non-food-deprived hamsters in food intake for 10 Rev, FW, and BW groups after injection of vehicle or Y1 antagonist into the PVH (A, C, and E) and PFA (B, D, and F). A: percent change in food intake of non-food-deprived hamsters of the 10 Rev group injected with vehicle [absolute values: 2 ± 1.7 (0–1 h), 0 ± 0 (1–2 h), 9 ± 3.2 (2–4 h), 15 ± 6.2 (4–24 h), and 26 ± 6.7 (cumulative)] and Y1 antagonist [absolute values: 4 ± 2.3 (0–1 h), 0 ± 0 (1–2 h), 6 ± 1.7 (2–4 h), 15 ± 4.9 (4–24 h), and 25 ± 3.7 (cumulative)] into the PVH. B: percent change in food intake of non-food-deprived hamsters of the 10 Rev group injected with vehicle [absolute values: 1 ± 1 (0–1 h), 1 ± 0 (1–2 h), 9.5 ± 1.5 (2–4 h), 12.5 ± 6.5 (4–24 h), and 23 ± 6 (cumulative)] and Y1 antagonist [absolute values: 1 ± 0.3 (0–1 h), 0 ± 0 (1–2 h), 1 ± 0 (2–4 h), 15 ± 3.2 (4–24 h), and 17.3 ± 2.8 (cumulative)] into the PFA. C: percent change in food intake of non-food-deprived hamsters of the FW group injected with vehicle [absolute values: 3 ± 1.3 (0–1 h), 0 ± 0 (1–2 h), 8 ± 2.3 (2–4 h), 18 ± 3.7 (4–24 h), and 29 ± 3.9 (cumulative)] and Y1 antagonist [absolute values: 2 ± 0.3 (0–1 h), 0 ± 0 (1–2 h), 12 ± 5.1 (2–4 h), 10 ± 3.7 (4–24 h), and 24 ± 2.3 (cumulative)] into the PVH. D: percent change in food intake of non-food-deprived hamsters of the FW group injected with vehicle [absolute values: 1 ± 0 (0–1 h), 1 ± 0.7 (1–2 h), 4.5 ± 0.5 (2–4 h), 32.0 ± 4.0 (4–24 h), and 38.5 ± 4.5 (cumulative)] and Y1 antagonist [absolute values: 1 ± 0.7 (0–1 h), 1 ± 0.7 (1–2 h), 2.3 ± 0.9 (2–4 h), 12.33 ± 6.7 (4–24 h), and 16.7 ± 7.1 (cumulative)] into the PFA. E: percent change in food intake of non-food-deprived hamsters of the BW group injected with vehicle [absolute values: 3 ± 0.7 (0–1 h), 1.0 ± 0.3 (1–2 h), 3.6 ± 1.5 (2–4 h), 18.0 ± 2.6 (4–24 h), and 25.6 ± 3.2 (cumulative)] and Y1 antagonist [absolute values: 0.2 ± 0.2 (0–1 h), 1.0 ± 1.0 (1–2 h), 3.0 ± 1.8 (2–4 h), 17.9 ± 3.9 (4–24 h) and 22.0 ± 2.6 (cumulative)] into the PVH. F: percent change in food intake of non-food-deprived hamsters of the BW group injected with vehicle [absolute values: 1 ± 0 (0–1 h), 1 ± 0.3 (1–2 h), 3 ± 2.2 (2–4 h), 17.1 ± 1.3 (4–24 h), and 22 ± 3.0 (cumulative)] and Y1 antagonist [absolute values: 1 ± 0.3 (0–1 h), 1 ± 0.3 (1–2 h), 6 ± 3.2 (2–4 h), 20 ± 6.4 (4–24 h), and 28 ± 8.5 (cumulative)] into the PFA. Values are means ± SE. *P < 0.05 vs. non-food-deprived hamsters. +P < 0.05 vs. PVH.

Similar articles

Cited by

References

    1. Ammar AA, Sederholm F, Saito TR, Scheurink AJ, Johnson AE, Sodersten P. NPY-leptin: opposing effects on appetitive and consummatory ingestive behavior and sexual behavior. Am J Physiol Regul Integr Comp Physiol 278: R1627–R1633, 2000. - PubMed
    1. Bartness TJ, Clein MR. Effects of food deprivation and restriction and metabolic blockers on food hoarding in Siberian hamsters. Am J Physiol Regul Integr Comp Physiol 266: R1111–R1117, 1994. - PubMed
    1. Bartness TJ, Day DE. Food hoarding: a quintessential anticipatory appetitive behavior. Prog Psychobiol Physiol Psychol 18: 69–100, 2003.
    1. Beneke WM, Davis CH. Relationship of hunger, use of a shopping list and obesity to food purchases. Int J Obes 9: 391–399, 1985. - PubMed
    1. Benoit SC, Clegg DJ, Woods SC, Seeley RJ. The role of previous exposure in the appetitive and consummatory effects of orexigenic neuropeptides. Peptides 26: 751–757, 2005. - PubMed

Publication types

MeSH terms