

Weather-related mortality: how heat, cold, and heat waves affect mortality in the United States
- PMID: 19194300
- PMCID: PMC3366558
- DOI: 10.1097/EDE.0b013e318190ee08
Weather-related mortality: how heat, cold, and heat waves affect mortality in the United States
Abstract
Background: Many studies have linked weather to mortality; however, role of such critical factors as regional variation, susceptible populations, and acclimatization remain unresolved.
Methods: We applied time-series models to 107 US communities allowing a nonlinear relationship between temperature and mortality by using a 14-year dataset. Second-stage analysis was used to relate cold, heat, and heat wave effect estimates to community-specific variables. We considered exposure timeframe, susceptibility, age, cause of death, and confounding from pollutants. Heat waves were modeled with varying intensity and duration.
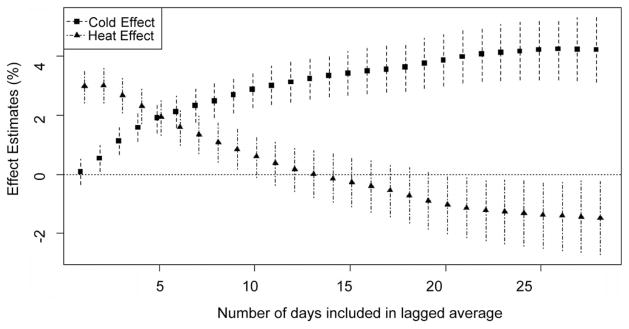
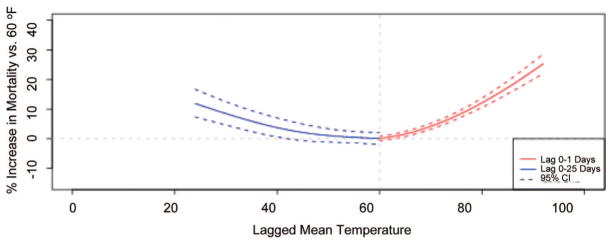
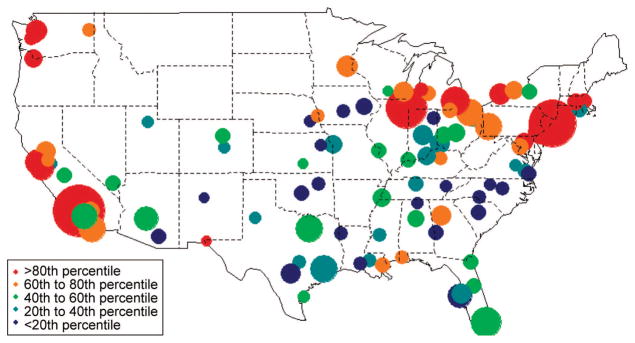
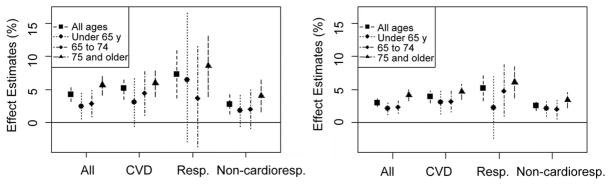
Results: Heat-related mortality was most associated with a shorter lag (average of same day and previous day), with an overall increase of 3.0% (95% posterior interval: 2.4%-3.6%) in mortality risk comparing the 99th and 90th percentile temperatures for the community. Cold-related mortality was most associated with a longer lag (average of current day up to 25 days previous), with a 4.2% (3.2%-5.3%) increase in risk comparing the first and 10th percentile temperatures for the community. Mortality risk increased with the intensity or duration of heat waves. Spatial heterogeneity in effects indicates that weather-mortality relationships from 1 community may not be applicable in another. Larger spatial heterogeneity for absolute temperature estimates (comparing risk at specific temperatures) than for relative temperature estimates (comparing risk at community-specific temperature percentiles) provides evidence for acclimatization. We identified susceptibility based on age, socioeconomic conditions, urbanicity, and central air conditioning.
Conclusions: Acclimatization, individual susceptibility, and community characteristics all affect heat-related effects on mortality.
Figures
References
-
- Barnett AG. Temperature and cardiovascular deaths in the US elderly: changes over time. Epidemiology. 2007;18:369–372. - PubMed
-
- O’Neill MS, Zanobetti A, Schwartz J. Modifiers of the temperature and mortality association in seven US cities. Am J Epidemiol. 2003;157:1074–1082. - PubMed
-
- Ren C, Williams GM, Morawska L, et al. Ozone modifies associations between temperature and cardiovascular mortality analysis of the NMMAPS data. Occup Environ Med. 2008;65:255–260. - PubMed
Publication types
MeSH terms
Grants and funding
LinkOut - more resources
Full Text Sources
