. 2007 Oct;1(1):61-74.
doi: 10.1016/j.scr.2007.09.004.

Effects of fgf2 and oxygen in the bmp4-driven differentiation of trophoblast from human embryonic stem cells

Affiliations

Effects of fgf2 and oxygen in the bmp4-driven differentiation of trophoblast from human embryonic stem cells

Padmalaya Das et al. Stem Cell Res. 2007 Oct.

Abstract

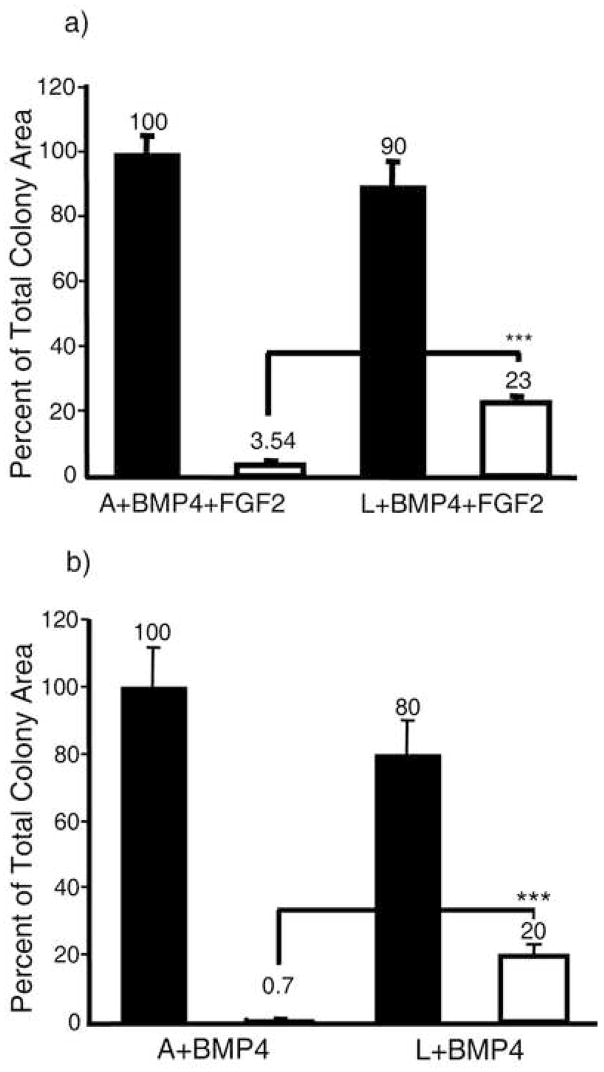
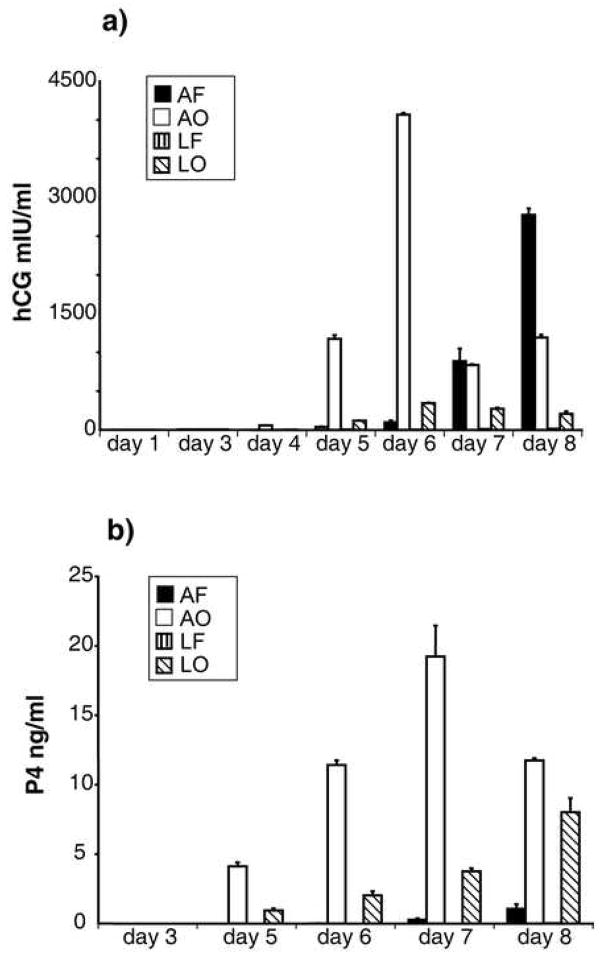
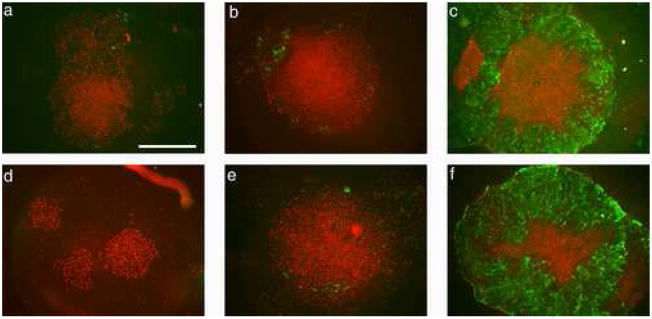
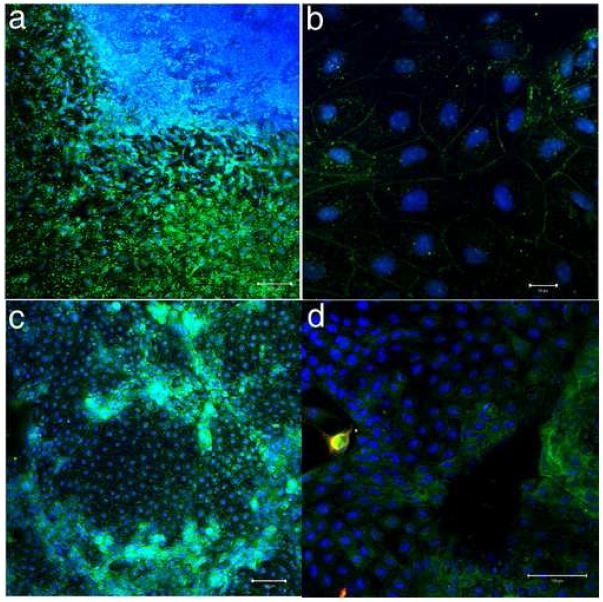
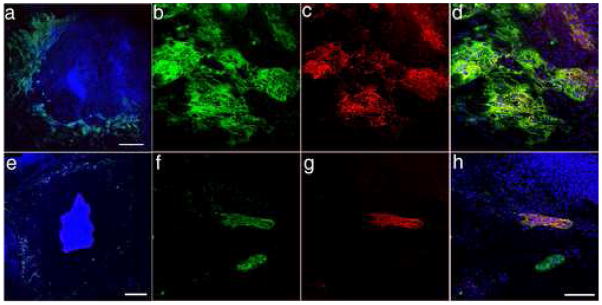
Human embryonic stem cells (hESC) differentiate into trophoblast when treated with BMP4. Here we studied the effects of either low (4 % O(2), L) or atmospheric O(2) (20% O(2), A) in the presence and absence of FGF2 on H1 hESC cultured in presence of BMP4. Differentiation progressed from the periphery towards the center of colonies. It occurred most quickly in the absence of FGF2 and under A and was slowest in presence of FGF2 and under L. Chorionic gonadotrophin (CG) production required A while FGF2 suppressed progesterone synthesis under both A and L. FGF2 was then omitted while we examined trophoblast markers SSEA-1 and cytokeratin-7 and -8, whose expression also progressed inwards from the periphery of colonies and occurred more rapidly under A than L. By day 5, most cells outside central islands of Oct4-positive cells were positive for these antigens under both conditions and many also expressed HLA-G, a marker of extra-villous cytotrophoblast. Under A, but not L, CGalpha and CGbeta became prominent in GATA2-positive, peripherally located, multinucleated cells. In conclusion, BMP4 induced conversion of hESC exclusively towards trophoblast; FGF2 slowed differentiation, while O(2) accelerated this process and promoted syncytiotrophoblast formation.

Keywords: Cytokeratin; Cytotrophoblast; HLA-G; Human chorionic gonadotropin; Progesterone; Syncytiotrophoblast.


Figures

FIGURE 1
FIGURE 1
a, Immunostaining of an H1 hESC colony, cultured in the presence of BMP4 and FGF2 for 9 days in atmospheric oxygen, for Oct4 (red) and hCGβ (green). Nuclei have been counterstained with TO-PRO 3 (blue). Twelve photographs were assembled from images acquired from the BioRad confocal system into a collage to visualize the entire colony. Oct4 was selected as a marker of pluripotent cells, while hCGβ is a marker of trophoblast and is associated with flattened areas of cells around the margins of the colonies. BMP4 concentration was 10 ng/ml, FGF2 4 ng/ml. b, Co-localization of hCGα (green) and hCGβ (red) in an H9 colony cultured as in Fig. 1a above. Regions staining with both antigens appear yellowish-white. Nuclei are stained blue. Some pinkish fluorescence associated with the central core region is non-specific and is seen on some control samples (not shown) in which the primary anti-hCGβ reagent was omitted. The image is a projection of a tile scanned image assembled by using Zeiss LSM software to visualize the entire colony in the x, y and z planes. The scale bar represents 500 μm.
FIGURE 2
FIGURE 2
Phase contrast images showing morphology of H1 hESC colonies cultured in the presence of 10ng/ml BMP4 for 1 (a,d,g,j), 3 (b,e,h,k) or 5 (c,f,i,l) days. Cells were cultured in ambient (A, a–c, g–i) or low (L, d–f, j–l) oxygen, and in the presence (a–f) or absence (g–l) of FGF2. An area of morphologically differentiated cells, characterized by a cobblestone appearance becomes visible at the periphery of the colony, and progresses inwards under all 4 culture conditions. A central area containing small, presumably undifferentiated cells becomes more densely packed with time in culture. Differentiation was slowest under L and FGF2 and most rapid under A without FGF2. The scale bar shown in panel a represents 1mm.
FIGURE 3
FIGURE 3
Morphometric analysis of differentiated and undifferentiated areas within H1 hESC colonies after growth for 5 days under either atmospheric (A) or low (L) oxygen conditions in the presence of BMP4 and FGF2 (a) or BMP alone (b). Data for each condition were obtained from the analysis of 10 colonies randomly sampled from three independent culture wells of a single experiment. Total colony area (black bars) and the undifferentiated area (open bars) are expressed relative to average total colony area in A (100%). *** P < 0.0001.
FIGURE 4
FIGURE 4
Daily accumulation of hCG (a) and progesterone (P4) (b) in medium after culturing H1 hESC with BMP4 either in the presence or absence of FGF2 and under either A or L oxygen conditions. Bars (± SEM) represent cultures exposed to (in order) atmospheric oxygen, FGF2 (AF); atmospheric oxygen, no FGF2 (AO); low oxygen, FGF2 (LF); low oxygen, no FGF2 (LO). Amounts of hCG and P4 released under LF conditions on all days were so low that they were not significantly different from zero. The data represent the results of a single, representative experiment performed on H1 cells. The experiment has been repeated four times, including twice with H9 cells. The peak and subsequent decline in the daily production of hCG on or about day-6 is observed consistently, but varies in magnitude.
FIGURE 5
FIGURE 5
H1 hESC cultured in the presence of BMP4 for 1 (a, d), 3 (b, e), or 5 days (c, f) in either low (L) (a–c) or atmospheric (A) (d–f) oxygen immunostained for Oct4 and SSEA-1. By d 5, immunostaining for Oct4 (red) becomes confined to an inner core of densely packed cells, but is still associated with nuclei of most cells in the colonies at d 1 and 3. Note that in d, which shows three small colonies, all the cells have apparently responded to BMP4 but all the nuclei remain Oct4-positive. By contrast, staining for the differentiation marker SSEA-1 (green) is initially confined to a few outer cells at d 3 (b, e), but becomes associated with all cells outside the dense central core of Oct4-positive cells by d 5 (c, f) under both oxygen conditions. Although, not shown, some smaller colonies were entirely SSEA1-positive and Oct4-negative by d 5. Whole colonies were imaged on the Olympus epifluorescence system under a 4x objective. The scale bar in a represents 1mm.
FIGURE 6
FIGURE 6
Expression of Oct4 (red) and cytokeratin 7 (green) in H1 (a–f) and H9 (g–i) hESC cultured for in the presence of BMP4. Cells were cultured in either at low (L) (a–c,g) or atmospheric (A) (d–f, h–i) oxygen for 1 (a,d), 3 (b,e), 4 (c,f), or 5 (g–i) days. By day 5 under both conditions, a central core stains intensely for Oct 4, whereas all cells outside the core are cytokeratin-positive, with intense staining near the cell membrane. The images in g and h are collages assembled through use of the Zeiss LSM software in order to visualize entire colonies. The scale bar for g and h represents 500 μm. In the higher power confocal image shown in i, the scale bar represents 50 μm. The scale bar represents 1mm in a–f, which were photographed on the Olympus epifluorescence system under a 4x objective.
FIGURE 7
FIGURE 7
Localization of HLA-G (green) in H9 hESC colonies treated with BMP4 for 5 days under atmospheric (A) oxygen. Nuclei are stained with TO-PRO 3 (blue). HLA-G expression was similar under L conditions (not shown). HLA-G was variably expressed among cells throughout the differentiated region of the colony, but not in the central core, which can be seen in the upper right-hand corner (a). HLA-G is localized to the edges, presumably plasma membrane and within vesicles in perinuclear region of most cells within the differentiated region of the colony (b). Some clusters of cells show intense cytoplasmic staining for HLA-G (c). In (d), the edge of the central core can be seen at right, and the outside edge of the colony at left. Cells which were positive for hCGβ(red) also stained for HLA-G within the cytoplasm, with the double-staining appearing yellow. The scale bars represent 100 μm in a,c, and d and 20μm in b.
FIGURE 8
FIGURE 8
Immunostaining for hCGα (green) and β (red) in H9 hESC colonies cultured under A (a–d) or L (e–h) conditions for five days in the presence of BMP4. Nuclei are stained with TO-PRO 3 (blue). The red hCGβ staining was relatively faint compared to the green hCGα, but yellowish color in merged images (a, d, e and h) indicate regions of dual expression. Projections of tile scans were used to visualize entire colonies in a and e, where the scale bar represents 500 μm. Larger areas of hCG-positive cells were present in cells cultured in atmospheric (A) compared to low (L) oxygen. Higher magnification images show the co-localization of hCGα (b, f) and –β (c, g) subunits (merged, d, h). Note that in d and h the areas of hCG staining appear to contain many nuclei within a common cytoplasm. All cells positive for hCGβ were also positive for hCGα, but the inverse was not true. The scale bar shown in (h) represents 200 μm in b–d, f–h.
FIGURE 9
FIGURE 9
The presence of syncytial-like structures in H9 hESC cultured in the presence of BMP4 for five days. Nuclei are blue. Images are 3D projections of multiple confocal sections. a, H9 cells positive for hCGβ (red) do not have desmosomes (green) separating nuclear areas, suggesting a continuous cytoplasm. b, The network of cytokeratin 8 (red) staining that delineates individual cells outside the hCGβ (green) areas is not apparent within areas staining for hCGβ (green). c, Syncytial-like regions with continuous cytokeratin 8 staining (red) also show intense nuclear staining for the transcription factor GATA2 (green). Scale bars represent 100 μm.

References

    1. Adelman DM, Gertsenstein M, Nagy A, Simon MC, Maltepe E. Placental cell fates are regulated in vivo by HIF-mediated hypoxia responses. Genes Dev. 2000;14:3191–203. - PMC - PubMed
    1. Alsat E, Wyplosz P, Malassine A, Guibourdenche J, Porquet D, Nessmann C, Evain-Brion D. Hypoxia impairs cell fusion and differentiation process in human cytotrophoblast, in vitro. J Cell Physiol. 1996;168:346–53. - PubMed
    1. Amit M, Carpenter MK, Inokuma MS, Chiu CP, Harris CP, Waknitz MA, Itskovitz-Eldor J, Thomson JA. Clonally derived human embryonic stem cell lines maintain pluripotency and proliferative potential for prolonged periods of culture. Dev Biol. 2000;227:271–8. - PubMed
    1. Bendall SC, Stewart MH, Menendez P, George D, Vijayaragavan K, Werbowetski-Ogilvie T, Ramos-Mejia V, Rouleau A, Yang J, Bosse M, et al. IGF and FGF cooperatively establish the regulatory stem cell niche of pluripotent human cells in vitro. Nature 2007 - PubMed
    1. Benirschke K. Anatomical relationship between fetus and mother. Ann N Y Acad Sci. 1994;731:9–20. - PubMed

Publication types

MeSH terms