

Rickettsia phylogenomics: unwinding the intricacies of obligate intracellular life
- PMID: 19194535
- PMCID: PMC2635572
- DOI: 10.1371/journal.pone.0002018
Rickettsia phylogenomics: unwinding the intricacies of obligate intracellular life
Abstract
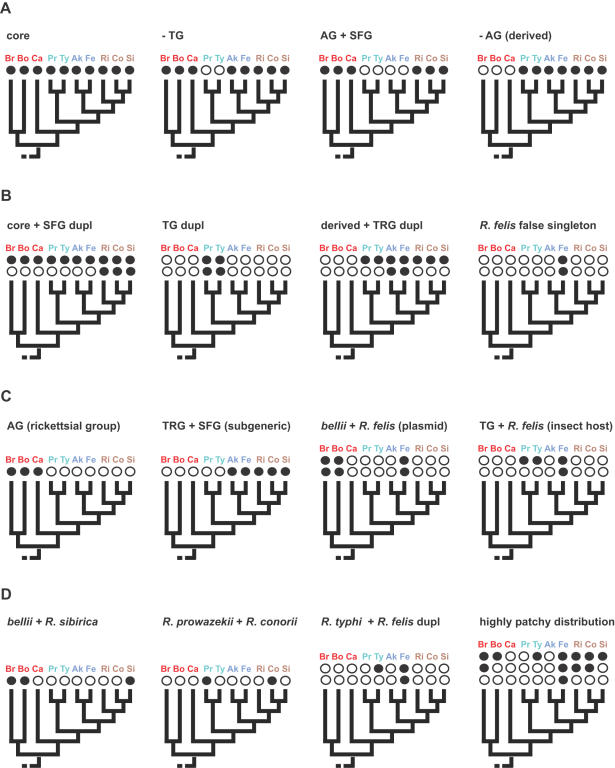
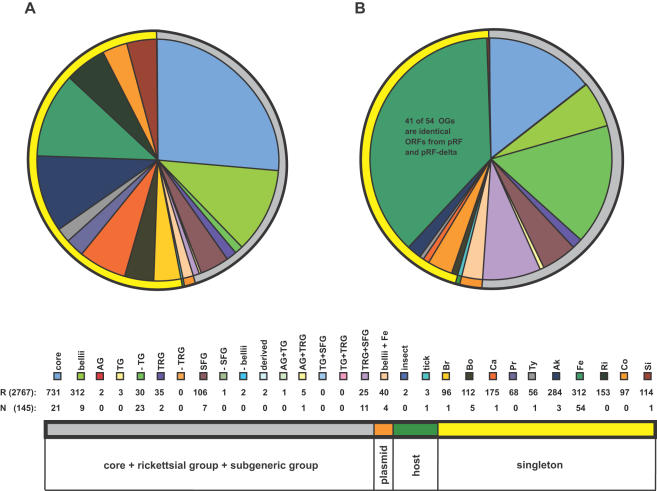
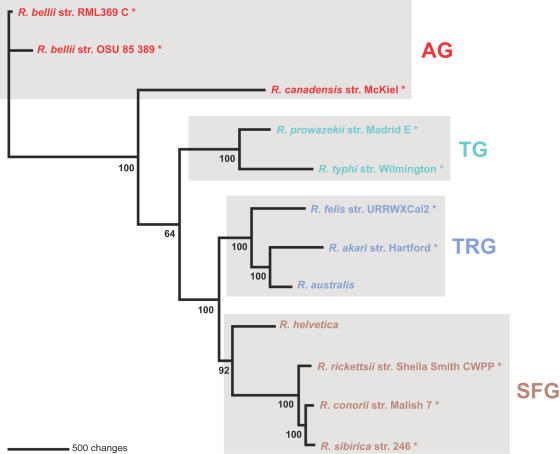
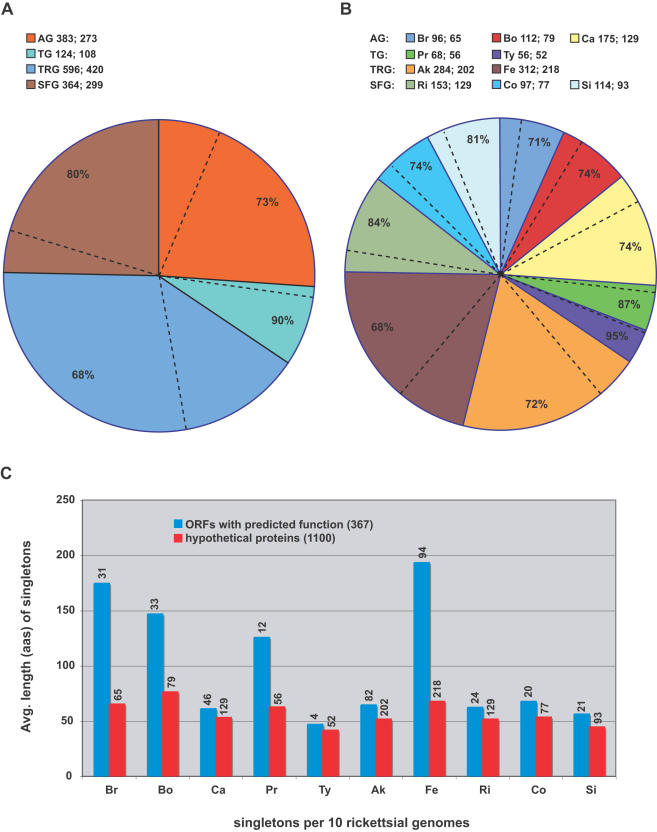
Background: Completed genome sequences are rapidly increasing for Rickettsia, obligate intracellular alpha-proteobacteria responsible for various human diseases, including epidemic typhus and Rocky Mountain spotted fever. In light of phylogeny, the establishment of orthologous groups (OGs) of open reading frames (ORFs) will distinguish the core rickettsial genes and other group specific genes (class 1 OGs or C1OGs) from those distributed indiscriminately throughout the rickettsial tree (class 2 OG or C2OGs).
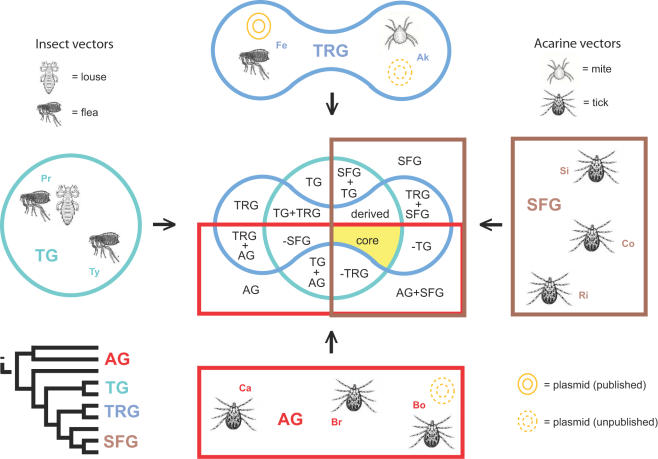
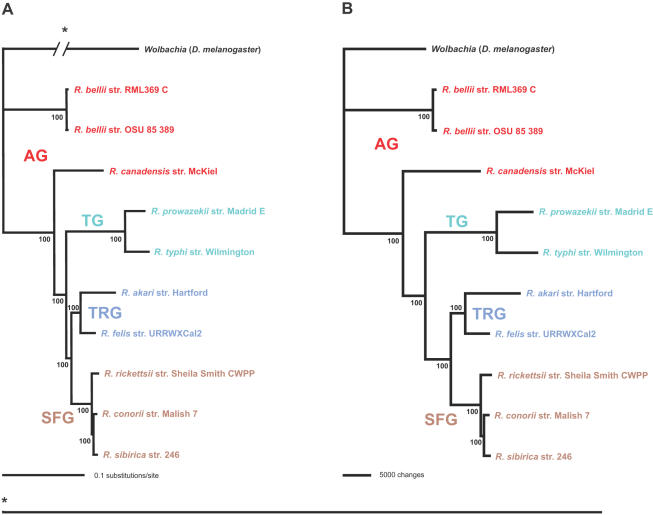
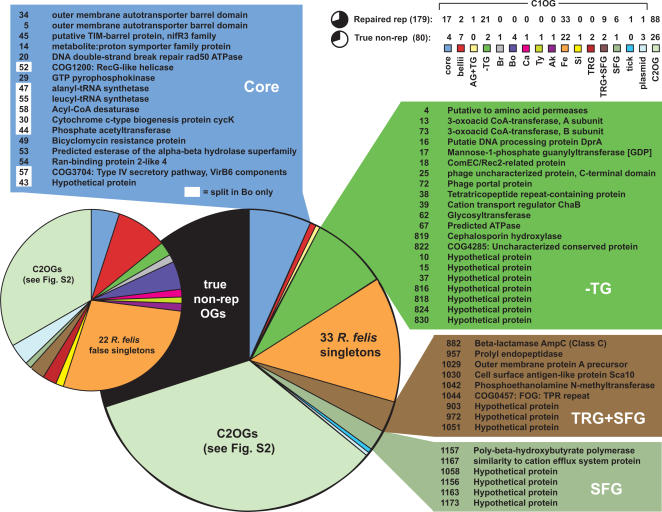
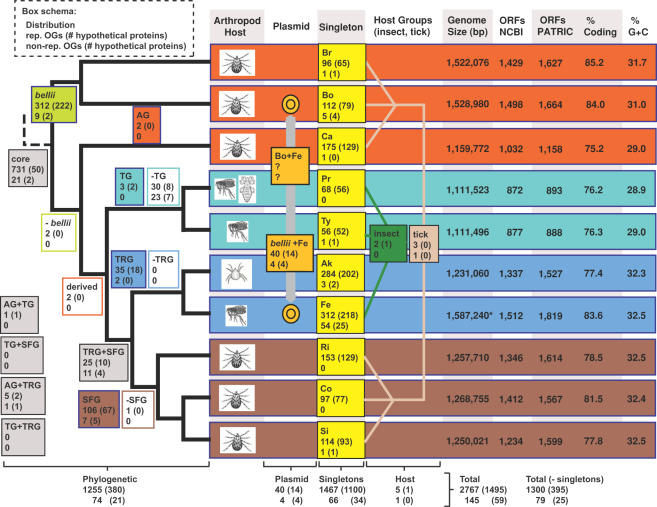
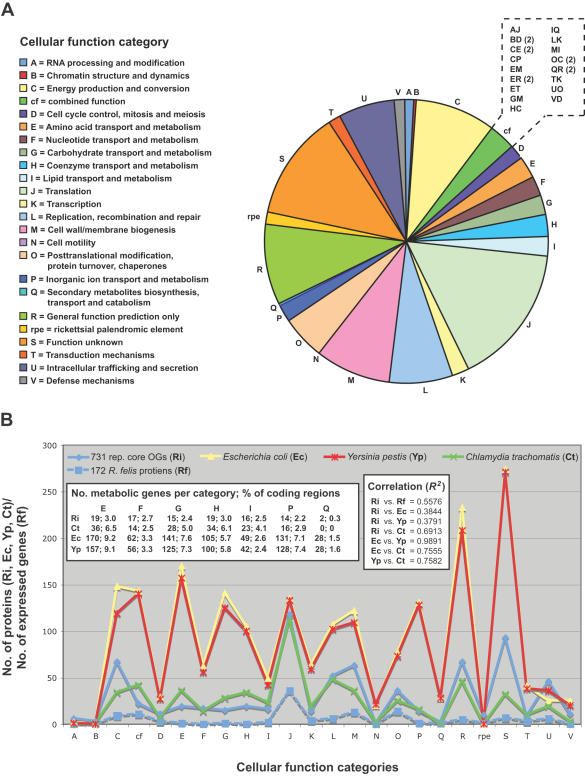
Methodology/principal findings: We present 1823 representative (no gene duplications) and 259 non-representative (at least one gene duplication) rickettsial OGs. While the highly reductive (approximately 1.2 MB) Rickettsia genomes range in predicted ORFs from 872 to 1512, a core of 752 OGs was identified, depicting the essential Rickettsia genes. Unsurprisingly, this core lacks many metabolic genes, reflecting the dependence on host resources for growth and survival. Additionally, we bolster our recent reclassification of Rickettsia by identifying OGs that define the AG (ancestral group), TG (typhus group), TRG (transitional group), and SFG (spotted fever group) rickettsiae. OGs for insect-associated species, tick-associated species and species that harbor plasmids were also predicted. Through superimposition of all OGs over robust phylogeny estimation, we discern between C1OGs and C2OGs, the latter depicting genes either decaying from the conserved C1OGs or acquired laterally. Finally, scrutiny of non-representative OGs revealed high levels of split genes versus gene duplications, with both phenomena confounding gene orthology assignment. Interestingly, non-representative OGs, as well as OGs comprised of several gene families typically involved in microbial pathogenicity and/or the acquisition of virulence factors, fall predominantly within C2OG distributions.
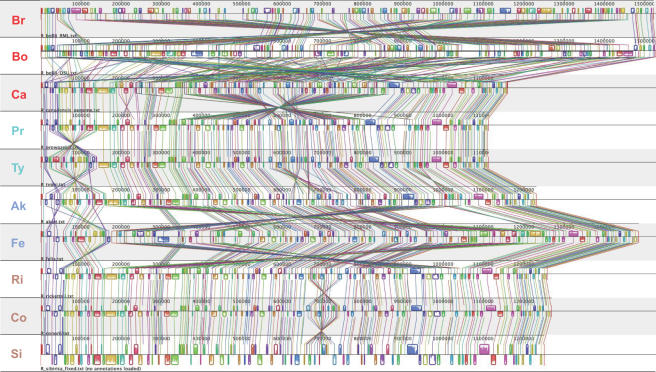
Conclusion/significance: Collectively, we determined the relative conservation and distribution of 14354 predicted ORFs from 10 rickettsial genomes across robust phylogeny estimation. The data, available at PATRIC (PathoSystems Resource Integration Center), provide novel information for unwinding the intricacies associated with Rickettsia pathogenesis, expanding the range of potential diagnostic, vaccine and therapeutic targets.
Conflict of interest statement
Figures
Similar articles
-
Plasmids and rickettsial evolution: insight from Rickettsia felis.PLoS One. 2007 Mar 7;2(3):e266. doi: 10.1371/journal.pone.0000266. PLoS One. 2007. PMID: 17342200 Free PMC article. Review.
-
Rickettsial evolution in the light of comparative genomics.Biol Rev Camb Philos Soc. 2011 May;86(2):379-405. doi: 10.1111/j.1469-185X.2010.00151.x. Epub 2010 Aug 17. Biol Rev Camb Philos Soc. 2011. PMID: 20716256 Review.
-
Bacterial small RNAs in the Genus Rickettsia.BMC Genomics. 2015 Dec 18;16:1075. doi: 10.1186/s12864-015-2293-7. BMC Genomics. 2015. PMID: 26679185 Free PMC article.
-
Origin and Evolution of Rickettsial Plasmids.PLoS One. 2016 Feb 11;11(2):e0147492. doi: 10.1371/journal.pone.0147492. eCollection 2016. PLoS One. 2016. PMID: 26866478 Free PMC article.
-
A Rickettsia genome overrun by mobile genetic elements provides insight into the acquisition of genes characteristic of an obligate intracellular lifestyle.J Bacteriol. 2012 Jan;194(2):376-94. doi: 10.1128/JB.06244-11. Epub 2011 Nov 4. J Bacteriol. 2012. PMID: 22056929 Free PMC article.
Cited by
-
Metagenomic analysis of human-biting cat fleas in urban northeastern United States of America reveals an emerging zoonotic pathogen.Sci Rep. 2020 Sep 24;10(1):15611. doi: 10.1038/s41598-020-72956-x. Sci Rep. 2020. PMID: 32973327 Free PMC article.
-
Evidence of Q Fever and Rickettsial Disease in Chile.Trop Med Infect Dis. 2020 Jun 11;5(2):99. doi: 10.3390/tropicalmed5020099. Trop Med Infect Dis. 2020. PMID: 32545152 Free PMC article.
-
Actin-based motility of bacterial pathogens: mechanistic diversity and its impact on virulence.Pathog Dis. 2016 Nov 1;74(8):ftw099. doi: 10.1093/femspd/ftw099. Epub 2016 Sep 20. Pathog Dis. 2016. PMID: 27655913 Free PMC article.
-
Rickettsia felis infection in a common household insect pest, Liposcelis bostrychophila (Psocoptera: Liposcelidae).Appl Environ Microbiol. 2010 Apr;76(7):2280-5. doi: 10.1128/AEM.00026-10. Epub 2010 Feb 5. Appl Environ Microbiol. 2010. PMID: 20139311 Free PMC article.
-
Analysis of the Rickettsia africae genome reveals that virulence acquisition in Rickettsia species may be explained by genome reduction.BMC Genomics. 2009 Apr 20;10:166. doi: 10.1186/1471-2164-10-166. BMC Genomics. 2009. PMID: 19379498 Free PMC article.
References
-
- Stothard DR, Fuerst PA. Evolutionary analysis of the spotted fever and typhus groups of Rickettsia using 16S rRNA gene sequences. Syst Appl Microbiol. 1995;18:52–61.
-
- Boone DR, Castenholz RW, Garrity GM. Bergey's manual of systematic bacteriology. New York, NY: Springer; 2001.
-
- Tamura A, Ohashi N, Urakami H, Miyamura S. Classification of Rickettsia tsutsugamushi in a new genus, Orientia gen. nov., as Orientia tsutsugamushi comb. nov. Int J Syst Bacteriol. 1995;45:589–591. - PubMed
Publication types
MeSH terms
Grants and funding
LinkOut - more resources
Full Text Sources
Molecular Biology Databases
Miscellaneous
