

Review
doi: 10.1016/j.rcl.2008.10.006.
Strategies for reducing radiation dose in CT
Affiliations
- PMID: 19195532
- PMCID: PMC2743386
- DOI: 10.1016/j.rcl.2008.10.006
Item in Clipboard
Review
Strategies for reducing radiation dose in CT
Radiol Clin North Am.
2009 Jan.
Abstract
In recent years, the media has focused on the potential danger of radiation exposure from CT, even though the potential benefit of a medically indicated CT far outweighs the potential risks. This attention has reminded the radiology community that doses must be as low as reasonably achievable (ALARA) while maintaining diagnostic image quality. To satisfy the ALARA principle, the dose reduction strategies described in this article must be well understood and properly used. The use of CT must also be justified for the specific diagnostic task.
Figures
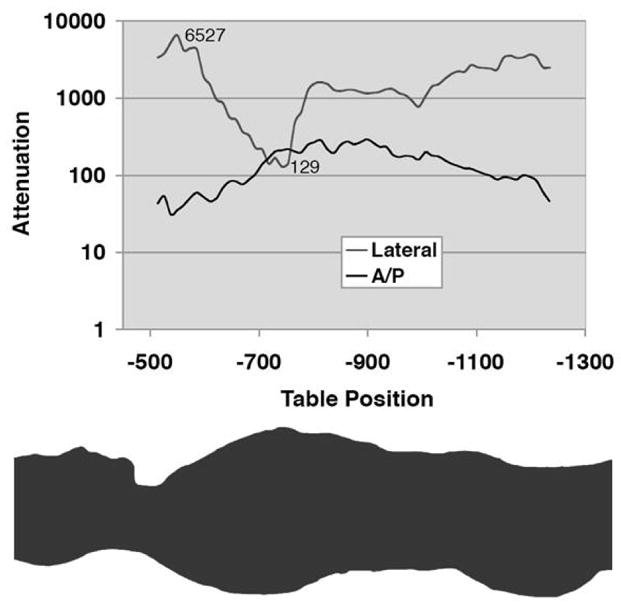
Graph (top) of relative attenuation values as a function of table position and associated body region (bottom) shows almost three orders of magnitude of variation in attenuation, according to body region and projection angle. [Reused with permission 37].

Graph of relative tube current superimposed on a CT projection radiograph illustrates the concept of longitudinal dose modulation. The prescribed tube current curve is determined by using attenuation data from the CT projection radiograph and a manufacturer-specific algorithm. [Reused with permission 37].

Figure 3a: Graph of the CT number of a 2% iodine solution for small, medium, and large phantoms at various x-ray tube potentials. Figure 3b: Graph of noise (standard deviation of CT numbers within the water background) in images of small, medium, and large phantoms at different tube potentials. Figure 3c: Graph of the contrast to noise ratio (CT number of iodine solution divided by the background noise level) in small, medium, and large phantoms at different tube potentials.

Figure 3a: Graph of the CT number of a 2% iodine solution for small, medium, and large phantoms at various x-ray tube potentials. Figure 3b: Graph of noise (standard deviation of CT numbers within the water background) in images of small, medium, and large phantoms at different tube potentials. Figure 3c: Graph of the contrast to noise ratio (CT number of iodine solution divided by the background noise level) in small, medium, and large phantoms at different tube potentials.
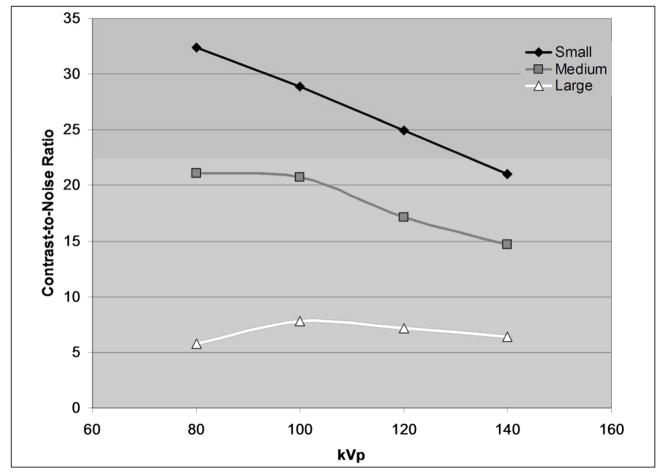
Figure 3a: Graph of the CT number of a 2% iodine solution for small, medium, and large phantoms at various x-ray tube potentials. Figure 3b: Graph of noise (standard deviation of CT numbers within the water background) in images of small, medium, and large phantoms at different tube potentials. Figure 3c: Graph of the contrast to noise ratio (CT number of iodine solution divided by the background noise level) in small, medium, and large phantoms at different tube potentials.

Depiction of ECG-based modulation of the tube current. The width of the temporal window having the maximum tube current (Max mA) can be selected by the user, while the temporal width of the image reconstruction window is fixed (Recon). For full quality images, the reconstruction window (darker grey time interval) should fall within the maximum mA window (lighter grey time interval). [Courtesy of Suhny Abbara, Massachusetts General Hospital]
References
-
- Brenner DJ, Hall EJ. Computed tomography--an increasing source of radiation exposure. N Engl J Med. 2007 Nov 29;357(22):2277–2284. - PubMed
-
- National Council on Radiation Protection and Measurements. Ionizing radiation exposure of the population of the United States. Bethesda, MD: National Council on Radiation Protection and Measurements; 1987. Report No. 93. NCRP Report No. 93.
-
- Donnelly LF, Emery KH, Brody AS, et al. Minimizing radiation dose for pediatric body applications of single-detector helical CT: Strategies at a large children’s hospital. AJR. 2001;176:303–306. - PubMed
-
- Brenner DJ, Elliston CD, Hall EJ, Berdon WE. Estimated risks of radiation-induced fatal cancer from pediatric CT. AJR. 2001;176:289–296. - PubMed
-
- The Associated Press. Report Links Increased Cancer Risk to CT Scans. New York Times. 2007 November 29;
Publication types
MeSH terms
Grants and funding
LinkOut - more resources
Full Text Sources
Other Literature Sources
Medical
