

Review
doi: 10.1021/cr800373w.
Fundamental aspects of protein-protein association kinetics
Affiliations
- PMID: 19196002
- PMCID: PMC2880639
- DOI: 10.1021/cr800373w
Item in Clipboard
Review
Fundamental aspects of protein-protein association kinetics
Chem Rev.
.
No abstract available
Figures
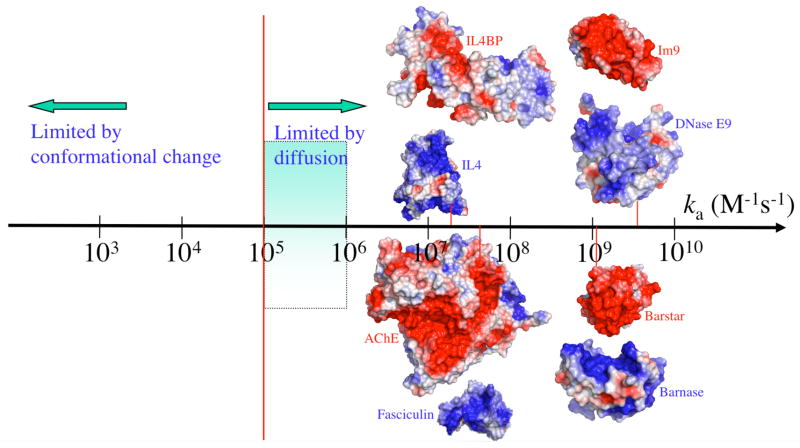
The wide spectrum of association rate constants. The red vertical line marks the start of the diffusion-controlled regime. The shaded range marks the absence of long-range forces. Adapted with permission from Ref. . Copyright 2008 Wiley Interscience..
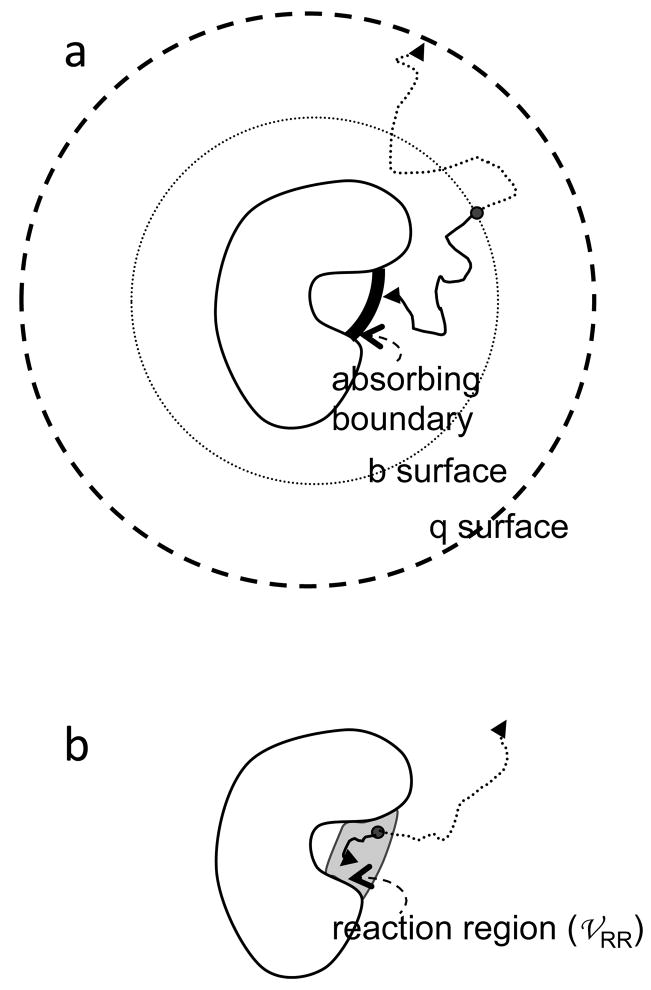
Two algorithms for calculating the diffusion-controlled association rate from Brownian dynamics simulations. (a) Algorithm of Northrup et al. (b) Algorithm of Zhou. In either algorithm, Brownian trajectories can be terminated by two triggers. In (a), the triggers are absorption by either the inner absorbing boundary or the q surface; in (b) the triggers are either reaction in the reaction region or when the lifetime of the trajectory exceeds a cutoff.
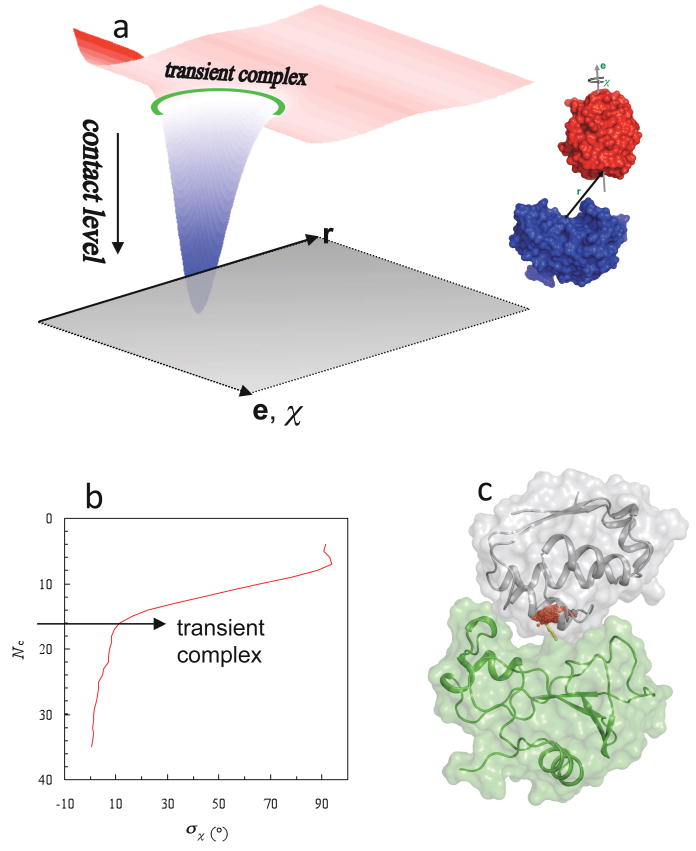
Location of the transient complex within the interaction energy landscape. (a) The energy landscape of protein-protein association. Translation (r) and rotation (e,χ) coordinates lie in the horizontal plane. The transient-complex ensemble is indicated by a green ring. The smooth energy landscape results from keeping the two proteins in their native internal conformations. (b) Identification of the transient complex, consisting of configurations with the contact level Nc*, where σχ is poised for a sharp increase with decreasing Nc. (c) Translational volume of the transient complex, which is the projection of the hypersurface Nc = Nc* into the 3 dimensions of translation, for the barnase-barstar pair. A cluster of red dots represent the locations of the displacement vector r (yellow arrow). Parts (a) and (b) were adapted with permission from Ref. . Copyright 2008 Wiley Interscience.
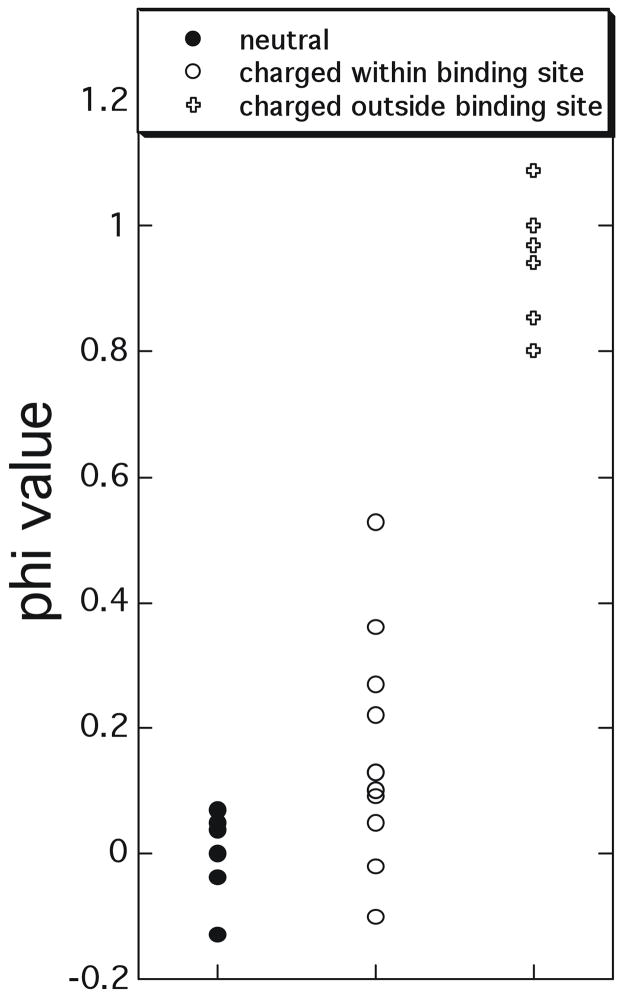
Φ-value analysis of the transient complex/transition state for association determined for ‘hotspot’ mutations (affecting the binding affinity by > 2 kcal/mol) collected from TEM1-BLIP, Barnase-barstar and Ras-Ral association.,, Φ-values close to 1 suggest that the involved residues have similar interactions in the transient complex/transition state and in the native complex, while values close to 0 indicate the residues do not form any inter-protein contacts in the transient complex/transition state.
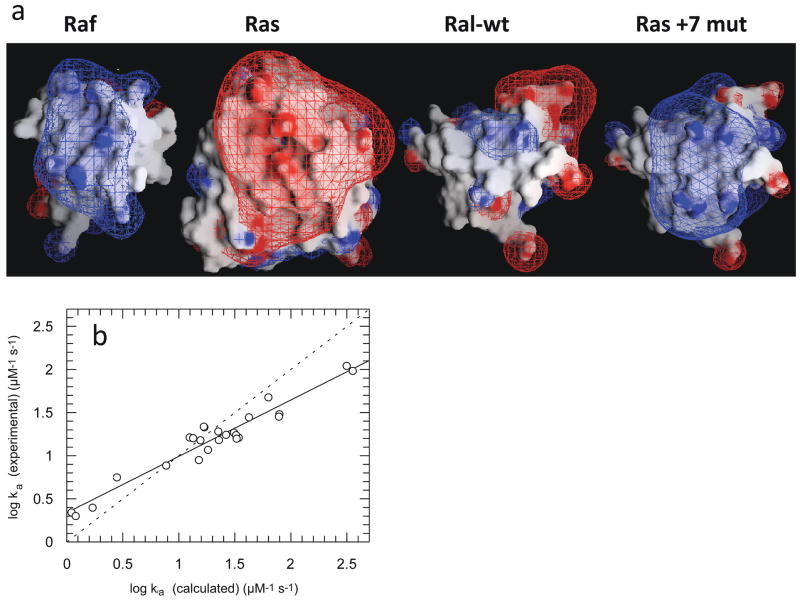
(a) Electrostatic potential maps of Ras, Raf-RBD, and Ral-RBD. The Ral + 7 mutant contains the mutations M26K/D47K/E54K/D90K, which were predicted by the program PARE to significantly increase the rate constant of association of Ral-RBD to Ras. These four mutations are located outside the Ras-binding site on Ral-RBD. The figure was drawn using the program GRASP, with the contours drawn at 2kBT/e (blue for positive and red for negative). (b) Plot of experimental values of the association rate constants for mutants of Ral-RBD to Ras vs. values calculated using PARE. Adapted with permission from Ref. . Copyright 2004 The National Academy of Sciences of the United States of America.
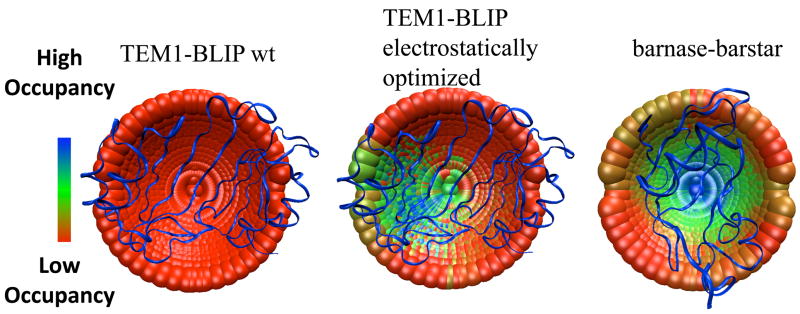
Mapping the transient complex/transition state for protein-protein association for the TEM1-BLIP and barnase-barstar complexes using double-mutant cycle data as constraints. Each point represents the center of mass of one of 2220 configurations of TEM1 or barnase perturbed from the native complex. (the mobile proteins in the simulations). BLIP and barstar are the fixed proteins and are represented as ribbon. The point in the middle of each cap represents the X-ray structure of the native complex. The different colors represent configurations selected by different filtering cutoffs; colder colors designate a configuration that passes a more stringent cutoff (thus, has a higher probability of occupancy in the transient complex/transition state). The TEM1-BLIP complex was electrostatically optimized using the program PARE, by introducing mutations located outside the binding interface.
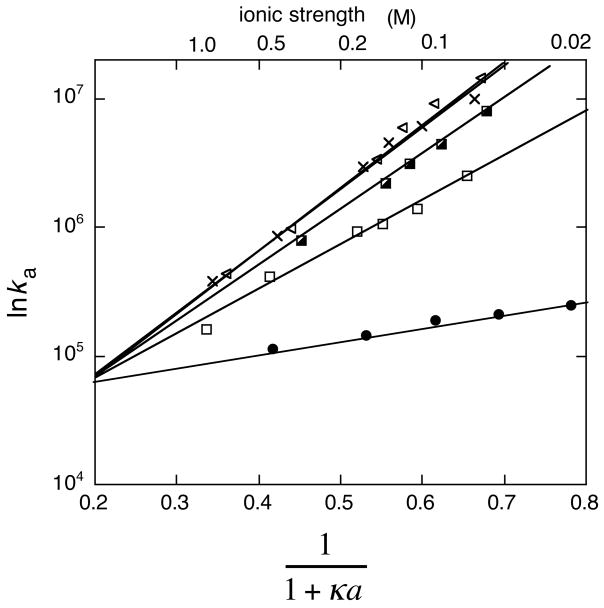
Association rate constants of wild-type and mutant TEM1-BLIP complexes determined at different salt concentrations, with lnka plotted against (1 + κa)−1. The data can be fitted to a line according to eq 23.
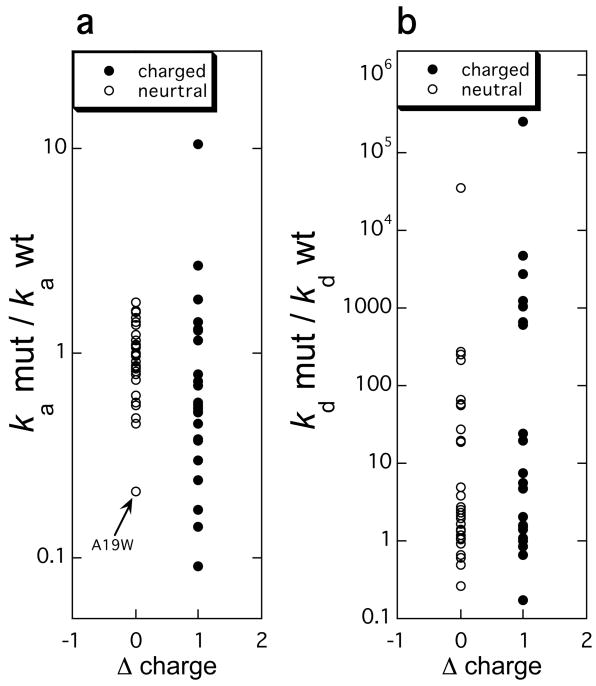
The changes in the rate constants of (a) association and (b) dissociation plotted against the change in charge resulting from a mutation. The rate constants were measured for 55 mutations in the barnase-barster, TEM1-BLIP, and IFNα2-IFNAR2 pairs on stopped-flow instruments.
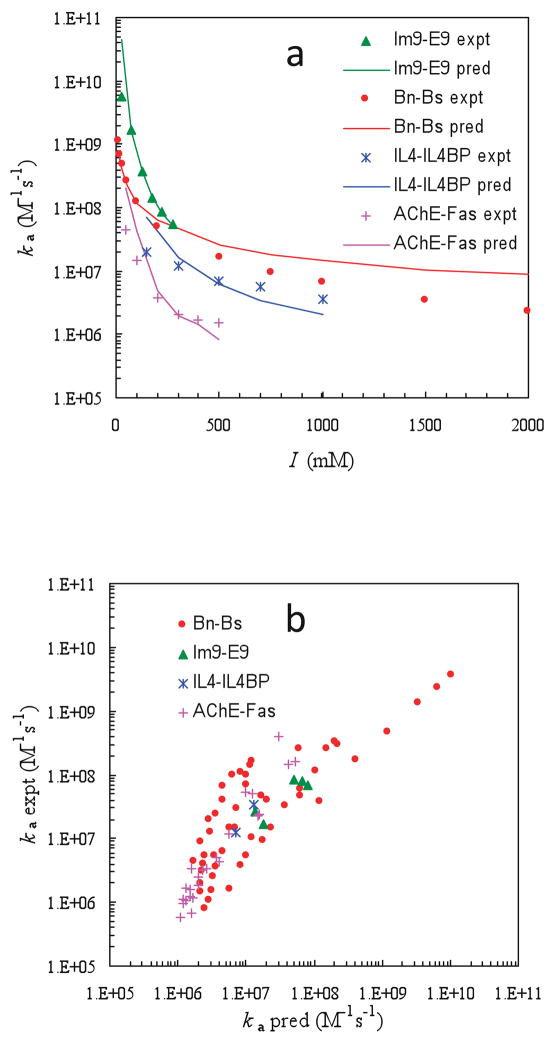
Comparison of predicted and experimental results for association rate constants. (a) Ionic-strength dependences of four protein pairs. (b) Twenty-three mutants at various ionic strengths. Reprinted with permission from Ref. . Copyright 2007 Elsevier.
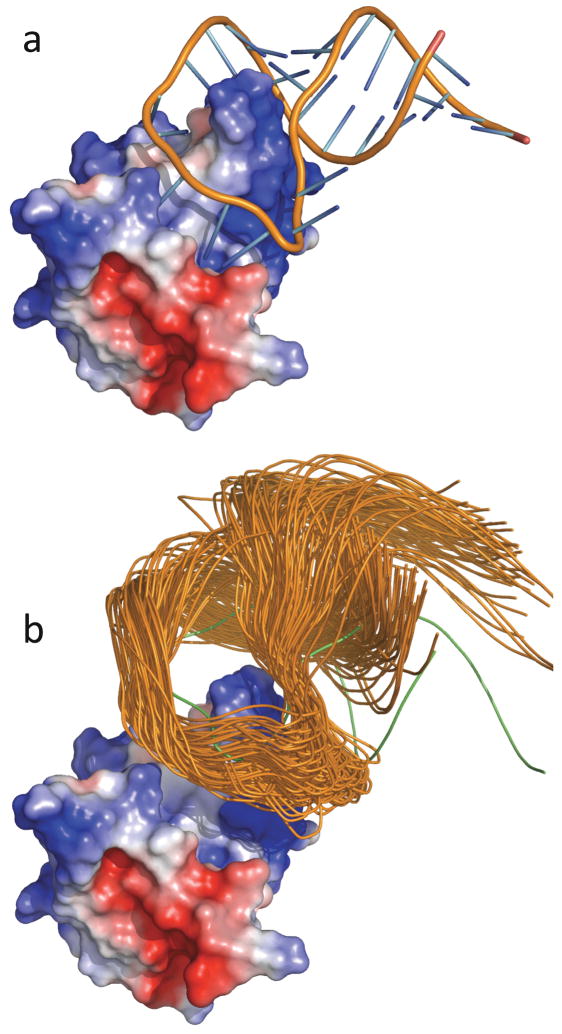
The U1 protein-RNA system. (a) The native complex. (b) Representative configurations in the transient complex. The U1A protein is represented by the electrostatic surface. Notice that the RNA is moved away from the protein in the transient complex. Reprinted with permission from Ref. . Copyright 2008 American Chemical Society.
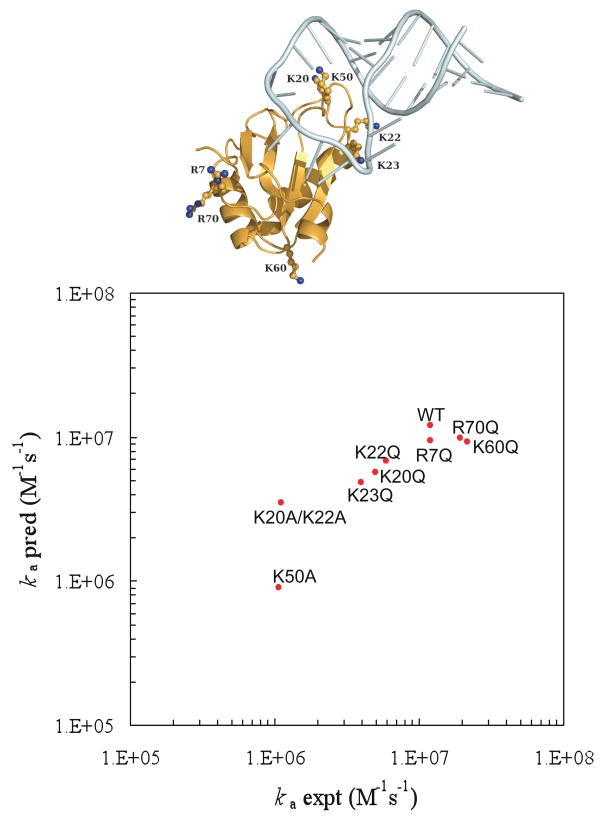
Comparison of predicted and experimental results for the binding rates of the wild-type U1 system and eight of its mutants. Locations of the mutated residues are shown in the inset. Reprinted with permission from Ref. . Copyright 2008 American Chemical Society.
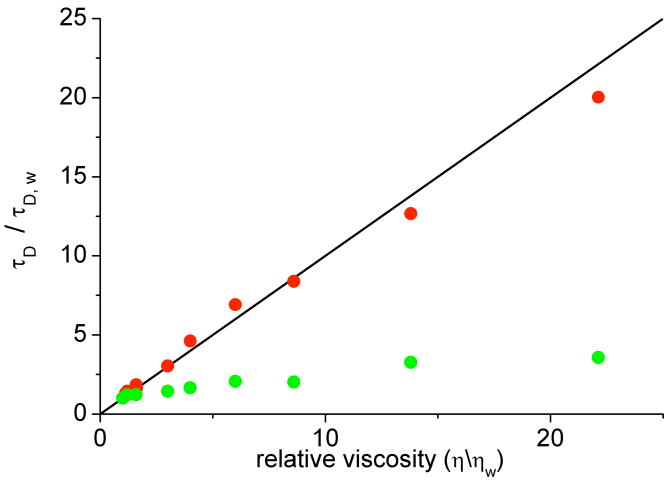
Protein translational and rotational correlation times in solutions of PEG of MW 8000, plotted as a function of solution viscosity. Translational correlation times (red circles) were measured by fluorescence correlation spectroscopy, while rotational correlation times (green circles) were measured by fluorescence polarization spectroscopy. All plotted values are normalized by water values. Reprinted with permission from Ref. . Copyright 2008 American Chemical Society.
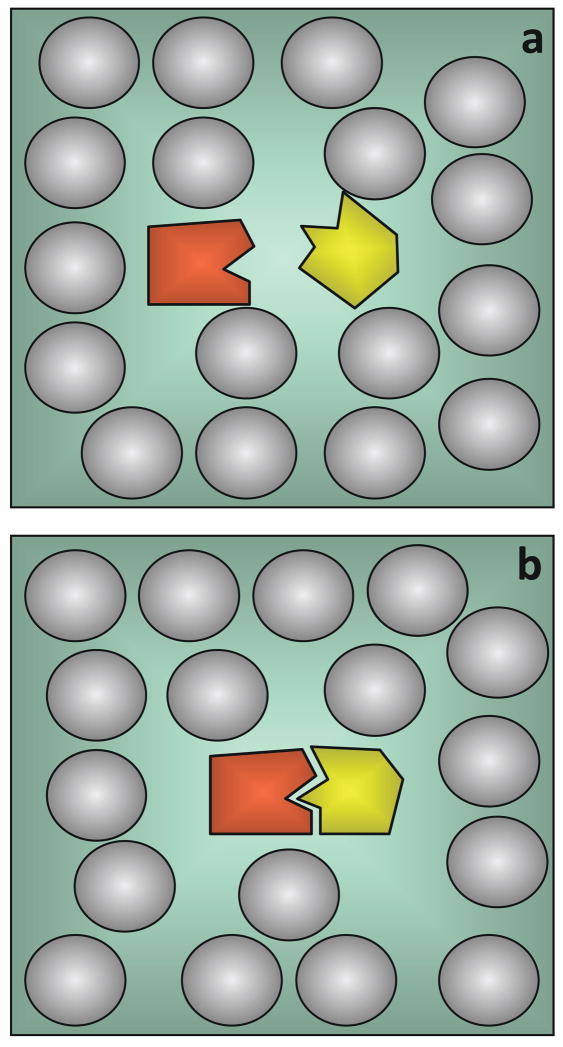
The depletion effect. (a) An osmotic pressure is exerted on two particles (proteins) immersed in a macromolecular solution, when their separation does not allow the solute macromolecules to penetrate the volume between them. (b) This entropic effect is minimal when the two particles are in contact (e.g. when two proteins associate).
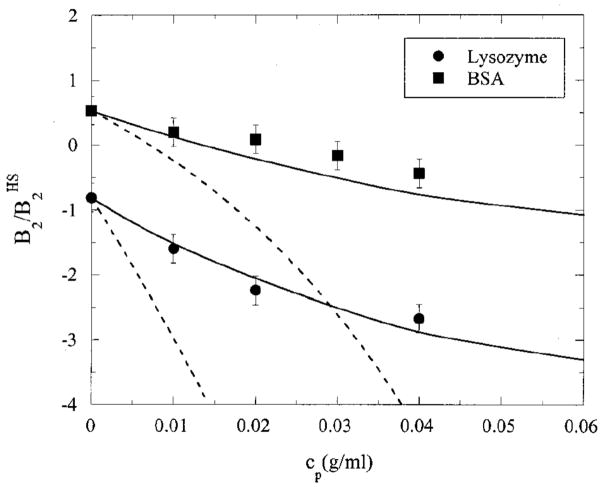
B2 (normalized by the hard-sphere value) for lysozyme and BSA as a function of concentration (wt%) of PEG of molecular weight 12000. The dotted and solid lines are AO and PRISM predictions, respectively. Adapted with permission from Ref. . Copyright 2000 American Institute of Physics.
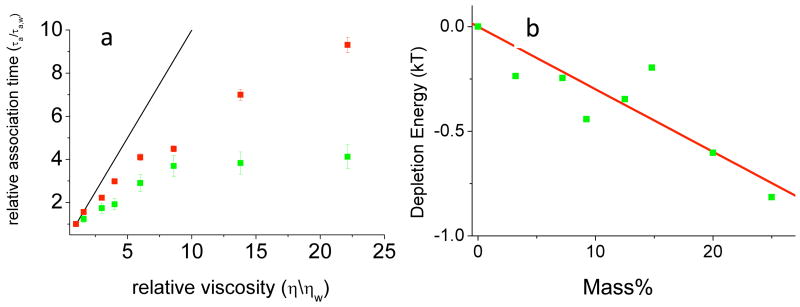
Effect of PEG8000 on association times of the TEM1-BLIP protein pair. (a) Measured association times (relative to water, green squares) and association times calculated from translational and rotational diffusion coefficients (red squares), as a function of relative viscosity. The black line is the Stokes-Einstein prediction. (b) Depletion energies obtained from the difference between measured and calculated association times are plotted as a function of polymer concentration. Reprinted with permission from Ref. . Copyright 2008 American Chemical Society.
References
-
- Zhou HX. Phys Biol. 2005;2:R1. - PubMed
-
- Terlau H, Shon KJ, Grilley M, Stocker M, Stuhmer W, Baldomero OM. Nature. 1996;381:148. - PubMed
-
- Radic Z, Kirchhoff PD, Quinn DM, McCammon JA, Taylor P. J Biol Chem. 1997;272:23265. - PubMed
-
- Wallis R, Moore GK, James R, Kleanthous C. Biochemistry. 1995;34:13743. - PubMed
Publication types
MeSH terms
Substances
Grants and funding
LinkOut - more resources
Full Text Sources
Other Literature Sources
