

Basic fibroblast growth factor delivery enhances adrenal cortical cellular regeneration
- PMID: 19196135
- PMCID: PMC2792105
- DOI: 10.1089/ten.tea.2008.0305
Basic fibroblast growth factor delivery enhances adrenal cortical cellular regeneration
Abstract
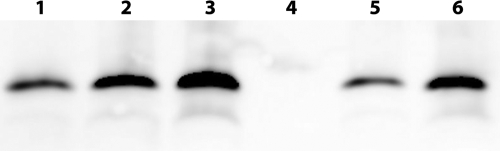
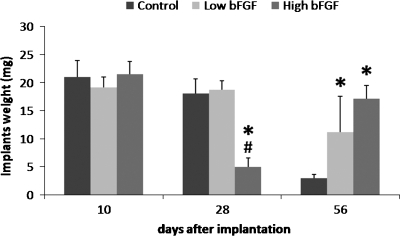
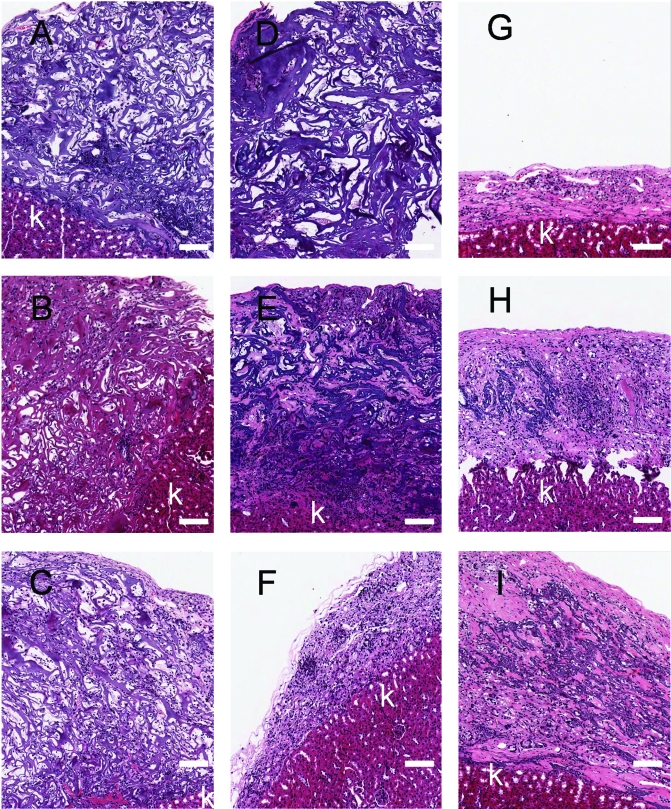
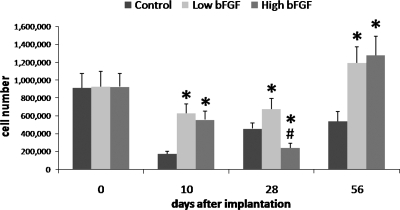
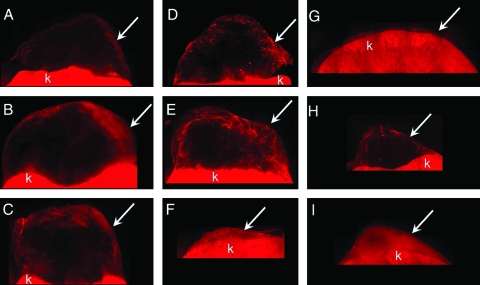
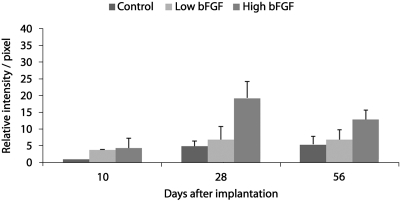
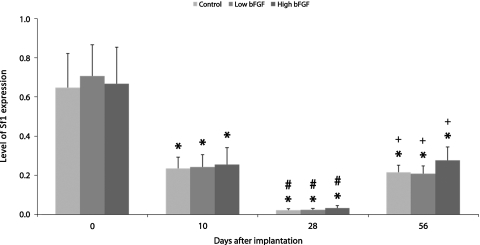
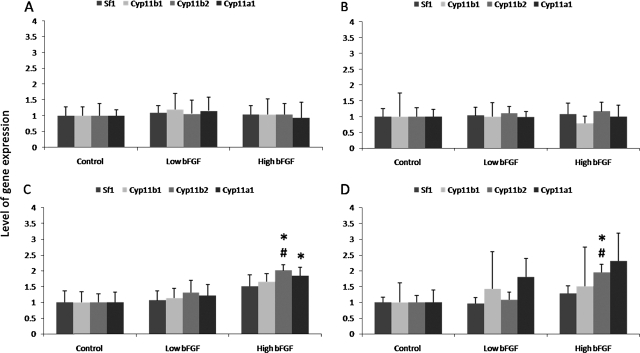
The effective delivery of angiogenic factors is a useful strategy for the engineering of vascularized tissues. When adrenal cortical cells were implanted in mice under the renal capsule, the size of the implant was reduced to about 100 microm in thickness after 8 weeks. Either low (approximately 2 microg) levels of basic fibroblast growth factor (bFGF) or high (approximately12 microg) levels of bFGF were encapsulated into poly-lactic-co-glycolic acid microspheres, and these bFGF-encapsulated microspheres were coimplanted with adrenal cortical cells. After 56 days, the implants with low and high levels of bFGF weighed five and eight times more, respectively, than the implants without bFGF delivery. The implants with bFGF-encapsulated microspheres also contained significantly more cells than the implants without bFGF delivery. The levels of adrenal cortical gene expression were not significantly changed with bFGF delivery. The implants with high levels of bFGF also had a more uniform distribution of anti-CD31 immunofluorescence. Based on the increased number of cells that expressed adrenal cortical genes, the delivery of bFGF enhanced adrenal cortical cellular regeneration, possibly through an angiogenic response.
Figures
Similar articles
-
Intestinal smooth muscle cell maintenance by basic fibroblast growth factor.Tissue Eng Part A. 2008 Aug;14(8):1395-402. doi: 10.1089/ten.tea.2007.0232. Tissue Eng Part A. 2008. PMID: 18680389
-
Tracheal defect repair using a PLGA-collagen hybrid scaffold reinforced by a copolymer stent with bFGF-impregnated gelatin hydrogel.Pediatr Surg Int. 2010 Jun;26(6):575-80. doi: 10.1007/s00383-010-2609-2. Epub 2010 Apr 28. Pediatr Surg Int. 2010. PMID: 20425118
-
MAPs/bFGF-PLGA microsphere composite-coated titanium surfaces promote increased adhesion and proliferation of fibroblasts.Biomed Mater. 2014 Jun;9(3):035006. doi: 10.1088/1748-6041/9/3/035006. Epub 2014 Apr 16. Biomed Mater. 2014. PMID: 24739496
-
[Effect of local delivery of basic fibroblast growth factor 2 on osseointegration around implant in tibia of diabetic rats].Zhongguo Xiu Fu Chong Jian Wai Ke Za Zhi. 2011 Mar;25(3):349-53. Zhongguo Xiu Fu Chong Jian Wai Ke Za Zhi. 2011. PMID: 21500592 Chinese.
-
Role of growth factors in the developmental regulation of the human fetal adrenal cortex.Steroids. 1997 Jan;62(1):62-72. doi: 10.1016/s0039-128x(96)00161-4. Steroids. 1997. PMID: 9029717 Review.
Cited by
-
FGF/FGFR signaling in adrenocortical development and tumorigenesis: novel potential therapeutic targets in adrenocortical carcinoma.Endocrine. 2022 Sep;77(3):411-418. doi: 10.1007/s12020-022-03074-z. Epub 2022 May 18. Endocrine. 2022. PMID: 35583844 Free PMC article. Review.
-
The First Reported Case of Hyperreninemic Hypoaldosteronism Due to Mucopolysaccharidosis Disorder.Cureus. 2020 Jun 7;12(6):e8487. doi: 10.7759/cureus.8487. Cureus. 2020. PMID: 32656005 Free PMC article.
-
Enucleation-induced rat adrenal gland regeneration: expression profile of selected genes involved in control of adrenocortical cell proliferation.Int J Endocrinol. 2014;2014:130359. doi: 10.1155/2014/130359. Epub 2014 Nov 6. Int J Endocrinol. 2014. PMID: 25431590 Free PMC article.
-
Molecular Mechanisms of Stem/Progenitor Cell Maintenance in the Adrenal Cortex.Front Endocrinol (Lausanne). 2017 Mar 23;8:52. doi: 10.3389/fendo.2017.00052. eCollection 2017. Front Endocrinol (Lausanne). 2017. PMID: 28386245 Free PMC article. Review.
-
FGF signalling through Fgfr2 isoform IIIb regulates adrenal cortex development.Mol Cell Endocrinol. 2013 May 22;371(1-2):182-8. doi: 10.1016/j.mce.2013.01.014. Epub 2013 Jan 29. Mol Cell Endocrinol. 2013. PMID: 23376610 Free PMC article.
References
-
- Oelkers W. Adrenal insufficiency. N Engl J Med. 1996;335:1206. - PubMed
-
- Jeffcoate W. Assessment of corticosteroid replacement therapy in adults with adrenal insufficiency. Ann Clin Biochem. 1999;36:151. - PubMed
-
- Dunn J.C. Chu Y. Lam M.M. Wu B.M. Atkinson J.B. McCabe E.R. Adrenal cortical cell transplantation. J Pediatr Surg. 2004;39:1856. - PubMed
-
- Mitani F. Mukai K. Miyamoto H. The undifferentiated cell zone is a stem cell zone in adult rat adrenal cortex. Biochem Biophys Acta. 2003;1619:317. - PubMed
-
- Esch F. Baird A. Ling N. Ueno N. Hill F. Denoroy L. Klepper R. Gospodarowicz D. Bohlen P. Guillemin R. Primary structure of bovine pituitary basic fibroblast growth factor (FGF ) and comparison with the amino-terminal sequence of bovine brain acidic FGF. Proc Natl Acad Sci USA. 1985;82:6507. - PMC - PubMed
Publication types
MeSH terms
Substances
Grants and funding
LinkOut - more resources
Full Text Sources
