

Anatomical and functional outcomes following a precise, graded, dorsal laceration spinal cord injury in C57BL/6 mice
- PMID: 19196178
- PMCID: PMC2991182
- DOI: 10.1089/neu.2008.0543
Anatomical and functional outcomes following a precise, graded, dorsal laceration spinal cord injury in C57BL/6 mice
Abstract
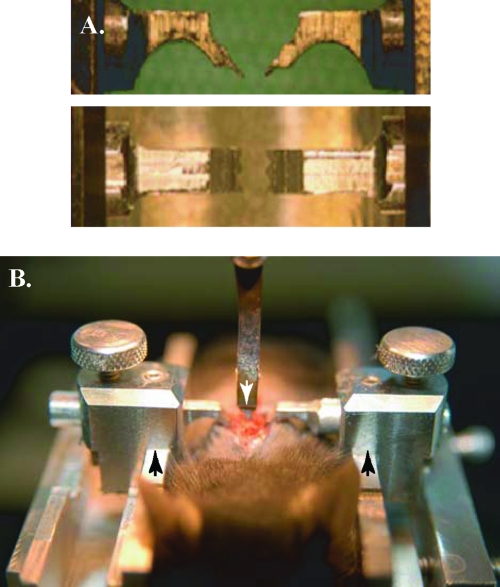
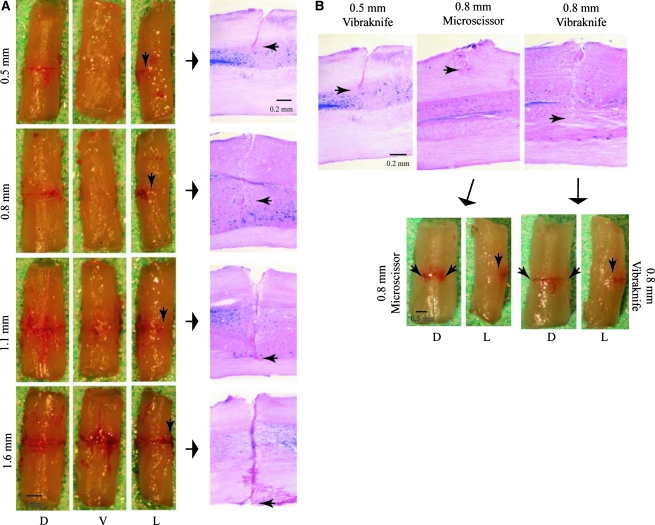
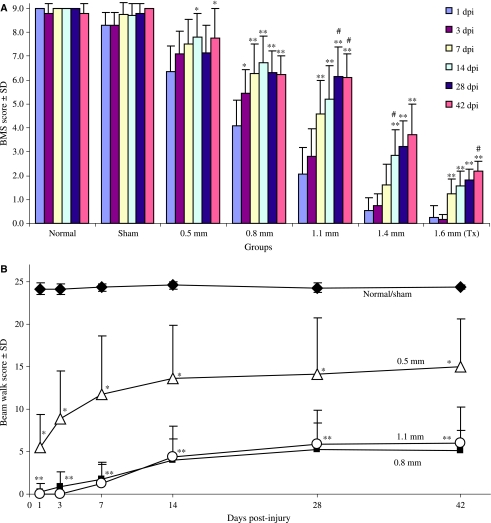
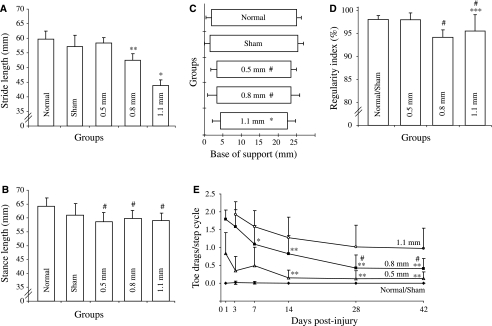
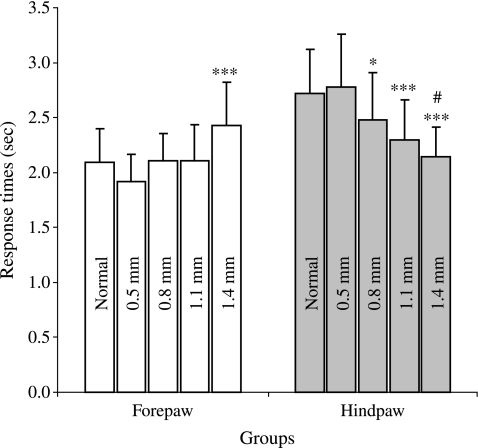
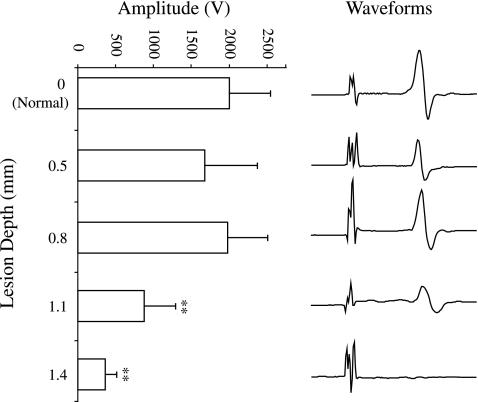
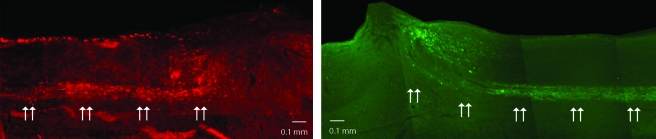
To study the pathophysiology of spinal cord injury (SCI), we used the LISA-Vibraknife to generate a precise and reproducible dorsal laceration SCI in the mouse. The surgical procedure involved a T9 laminectomy, dural resection, and a spinal cord laceration to a precisely controlled depth. Four dorsal hemisection injuries with lesion depths of 0.5, 0.8, 1.1, and 1.4 mm, as well as normal, sham (laminectomy and dural removal only), and transection controls were examined. Assessments including the Basso Mouse Scale (BMS), footprint analysis, beam walk, toe spread reflex, Hargreaves' test, and transcranial magnetic motor-evoked potential (tcMMEP) analysis were performed to assess motor, sensorimotor, and sensory function. These outcome measures demonstrated significant increases in functional deficits as the depth of the lesion increased, and significant behavioral recovery was observed in the groups over time. Quantitative histological examination showed significant differences between the injury groups and insignificant lesion depth variance within each of the groups. Statistically significant differences were additionally found in the amount of ventral spared tissue at the lesion site between the injury groups. This novel, graded, reproducible laceration SCI model can be used in future studies to look more closely at underlying mechanisms that lead to functional deficits following SCI, as well as to determine the efficacy of therapeutic intervention strategies in the injury and recovery processes following SCI.
Figures
Similar articles
-
Diffusion tensor imaging at 3 hours after traumatic spinal cord injury predicts long-term locomotor recovery.J Neurotrauma. 2010 Mar;27(3):587-98. doi: 10.1089/neu.2009.1063. J Neurotrauma. 2010. PMID: 20001686 Free PMC article.
-
Locomotor deficits and adaptive mechanisms after thoracic spinal cord contusion in the adult rat.J Neurotrauma. 2006 Jan;23(1):1-17. doi: 10.1089/neu.2006.23.1. J Neurotrauma. 2006. PMID: 16430369
-
Behavioral and histological characterization of unilateral cervical spinal cord contusion injury in rats.J Neurotrauma. 2006 Jan;23(1):36-54. doi: 10.1089/neu.2006.23.36. J Neurotrauma. 2006. PMID: 16430371
-
Plasticity of the spinal neural circuitry after injury.Annu Rev Neurosci. 2004;27:145-67. doi: 10.1146/annurev.neuro.27.070203.144308. Annu Rev Neurosci. 2004. PMID: 15217329 Review.
-
Changes in CNS structures after spinal cord lesions implications for BMI.Prog Brain Res. 2011;194:191-202. doi: 10.1016/B978-0-444-53815-4.00007-8. Prog Brain Res. 2011. PMID: 21867804 Review.
Cited by
-
Nogo-A and LINGO-1: Two Important Targets for Remyelination and Regeneration.Int J Mol Sci. 2023 Feb 24;24(5):4479. doi: 10.3390/ijms24054479. Int J Mol Sci. 2023. PMID: 36901909 Free PMC article. Review.
-
Gait analysis in normal and spinal contused mice using the TreadScan system.J Neurotrauma. 2009 Nov;26(11):2045-56. doi: 10.1089/neu.2009.0914. J Neurotrauma. 2009. PMID: 19886808 Free PMC article.
-
A New Apparatus for Recording Evoked Responses to Painful and Non-painful Sensory Stimulation in Freely Moving Mice.Front Neurosci. 2021 Feb 12;15:613801. doi: 10.3389/fnins.2021.613801. eCollection 2021. Front Neurosci. 2021. PMID: 33642977 Free PMC article.
-
Controlled cervical laceration injury in mice.J Vis Exp. 2013 May 9;(75):e50030. doi: 10.3791/50030. J Vis Exp. 2013. PMID: 23685551 Free PMC article.
-
Class I histone deacetylase (HDAC) inhibitor CI-994 promotes functional recovery following spinal cord injury.Cell Death Dis. 2018 May 1;9(5):460. doi: 10.1038/s41419-018-0543-8. Cell Death Dis. 2018. PMID: 29700327 Free PMC article.
References
-
- Allen A.R. Surgery of experimental lesion of spinal cord equivalent to crush injury of fracture dislocation of spinal column: a preliminary report. JAMA. 1911;57:878–880.
-
- Balantine J.D. Pathology of experimental spinal cord trauma. I. The necrotic lesion as a function of vascular injury. Lab. Invest. 1978;39:236–253. - PubMed
-
- Bartholdi D. Schwab M.E. Expression of pro-inflammatory cytokine and chemokine mRNA upon experimental spinal cord injury in mouse: an in situ hybridization study. Euro. J. Neurosci. 1997;9:1422–1438. - PubMed
-
- Basso D.M. Fisher L.C. The Basso Mouse Scale for Locomotion (BMS) is a more sensitive indicator of recovery than the BBB scale in mice with spinal cord injury. Society for Neuroscience Abstract. 2003
-
- Basso D.M. Fisher L.C. Anderson A.J. Jakeman L.B. McTigue D.M. Popovich P.G. Basso Mouse Scale for locomotion detects differences in recovery after spinal cord injury in five common mouse strains. J. Neurotrauma. 2006;23:635–659. - PubMed
Publication types
MeSH terms
Grants and funding
LinkOut - more resources
Full Text Sources
Medical