. 2009 Apr;156(1):69-77.
doi: 10.1111/j.1365-2249.2009.03875.x. Epub 2009 Jan 22.

Differential cytokine secretion and early treatment response in patients with pulmonary tuberculosis

Affiliations

Differential cytokine secretion and early treatment response in patients with pulmonary tuberculosis

J F Djoba Siawaya et al. Clin Exp Immunol. 2009 Apr.

Abstract

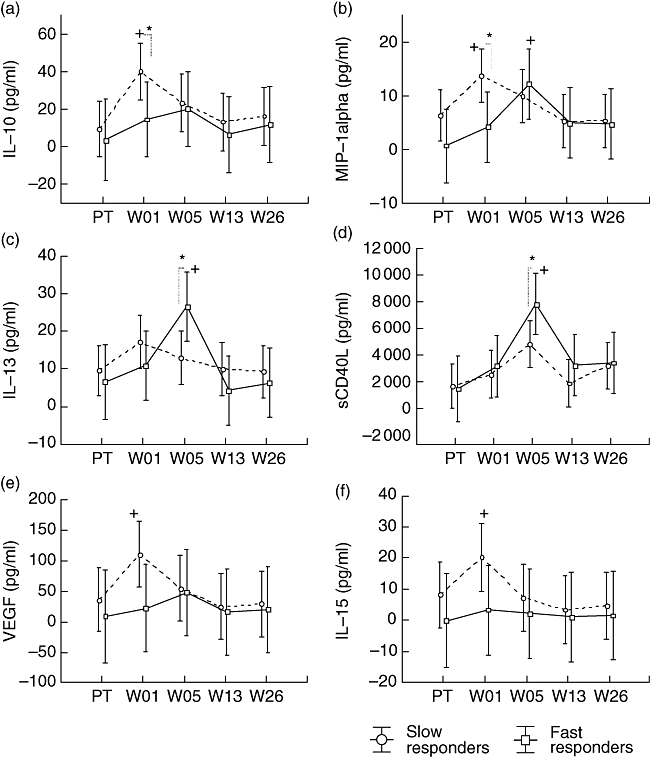
Biomarkers for treatment response would facilitate the testing of urgently needed new anti-tuberculous drugs. The present study investigated the profiles of 30 proinflammatory, anti-inflammatory and angiogenic factors [epidermal growth factor, eotaxin, fractalkine, granulocyte colony-stimulating factor, granulocyte-macrophage colony-stimulating factor, interleukin (IL)-1alpha, IL-1beta, IL-1ra, IL-2, IL-4, IL-5, IL-6, IL-7, IL-8, IL-10, IL-12p40, IL-12p70, IL-13, IL-15, IL-17, interferon-gamma, interferon-inducible protein-10, Krebs von den Lungen-6, monocyte chemotactic protein-1, macrophage inflammatory protein (MIP)-1alpha, MIP-1beta, sCD40L, transforming growth factor-alpha, tumour necrosis factor-alpha and vascular endothelial growth factor] in the plasma of 12 healthy tuberculin skin test-positive community controls and 20 human immunodeficiency virus-negative patients with active tuberculosis (TB) and identified potential biomarkers for early treatment response. We showed differences in the level of circulating cytokines between healthy controls and TB patients, but also between fast responders and slow responders to anti-tuberculosis treatment. The general discriminant analysis based on pre-treatment and week 1 measurements identified 10 sets of three-variable models that could classify fast and slow responders with up to 83% accuracy. Overall, this study shows the potential of cytokines as indicators of anti-tuberculosis treatment response.


Figures

Fig. 1
Fig. 1
Plasma concentrations of (a) interleukin (IL)-6 and (b) interferon-inducible protein (IP)-10 in individuals with latent tuberculosis infection (LTBI) and active tuberculosis (TB) pretreatment (PT). (c) Mean concentrations of IL-6 and (d) IP-10 in the plasma of active TB patients PT, and at weeks (W) 1, 5, 13 and 26 of treatment. The vertical bars denote 95% confidence intervals. *Significant difference between groups; +: significant difference from pretreatment. */+: P < 0·05; **/++: P < 0·005; ***/+++: P < 0·0005.
Fig. 2
Fig. 2
Mean concentrations of (a) interleukin (IL)-12p40, (b) monocyte chemotactic protein (MCP)-1, (c) macrophage inflammatory protein (MIP)-1α, (d) MIP-1β, (e) sCD40L and (f) tumour necrosis factor (TNF)-α in the plasma of active tuberculosis (TB) patients pretreatment (PT) and at weeks (W) 1, 5, 13 and 26 of treatment. The vertical bars denote 95% confidence intervals. +Significant differences from pretreatment; +: P < 0·05; ++: P < 0·005; +++: P < 0·0005.
Fig. 3
Fig. 3
Plasma concentrations of (a) eotaxin in individuals with latent tuberculosis infection (LTBI) and active active tuberculosis (TB) (pretreatment). (b) Mean concentrations of eotaxin, (c) interleukin (IL)-10 and (d) IL-13 in the plasma of active TB patients pretreatment (PT), at weeks (W) 1, 5, 13 and 26 of treatment. The vertical bars denote 95% confidence intervals. *Significant difference between groups: +: significant differences from pretreatment; */+: P < 0·05; **/++: P < 0·005; ***/+++: P < 0·0005.
Fig. 4
Fig. 4
Plasma concentrations of (a) Krebs von den Lungen (KL)-6 protein in individuals with latent tuberculosis infection (LTBI) and active tuberculosis (TB) [pretreatment (PT)]. (b) Mean concentrations of epidermal growth factor (EGF) in the plasma of active TB patients pretreatment and at weeks (W) 1, 5, 13 and 26 of treatment. The vertical bars denote 95% confidence intervals. *Significant difference between groups; +: significant difference from pretreatment; */+: P < 0·05; **/++: P < 0·005; ***/+++: P < 0·0005.
Fig. 5
Fig. 5
Differences in plasma markers of active tuberculosis (TB) patients with fast and slow treatment responses. Blood was collected pretreatment (PT) and at weeks (W) 1, 5, 13 and 26 of treatment. Host markers were measured using the Luminex platform. (a) Interleukin (IL)-10, (b) macrophage inflammatory protein (MIP)-1α, (c) IL-13, (d) sCD40L, (e) vascular endothelial growth factor (VEGF), (f) IL-15 mean concentrations are shown. The vertical bars denote 95% confidence intervals. *Significant difference between groups; +: significant differences from pretreatment; */+: P < 0·05; **/++: P < 0·005; ***/+++: P < 0·0005.
Fig. 6
Fig. 6
Number of inclusions of individual variables into the top 10 three-variable predictive models for week 8 sputum status as determined by general discriminant analysis (GDA). The top 10 models had accuracies exceeding 83%. W00 represents pretreatment and W01 represents week 1 of tuberculosis treatment.

Similar articles

Cited by

References

    1. Cardona PJ, Ruiz-Manzano J. On the nature of Mycobacterium tuberculosis-latent bacilli. Eur Respir J. 2004;24:1044–51. - PubMed
    1. Global Tuberculosis Control: Surveillance. 2008. Planning, Financing: WHO report.
    1. Dolin PJ, Raviglione MC, Kochi A. Global tubercolosis incidence and mortality during 1990–2000. Bull WHO. 1994;72:213–20. - PMC - PubMed
    1. World Health Organization. World Health Organization fact sheet. Geneva, Switzerland: World Health Organization; 2002.
    1. Enarson DE, Rieder HL, Arnadottir T, Trebucq A. Management of tuberculosis a guide for low income countries. 5th edn. Paris: IUATLD; 2000.

Publication types