Review
. 2009 May;23(5):590-9.
doi: 10.1210/me.2008-0204. Epub 2009 Feb 5.

GPCR and G proteins: drug efficacy and activation in live cells

Affiliations
Review

GPCR and G proteins: drug efficacy and activation in live cells

Jean-Pierre Vilardaga et al. Mol Endocrinol. 2009 May.

Abstract

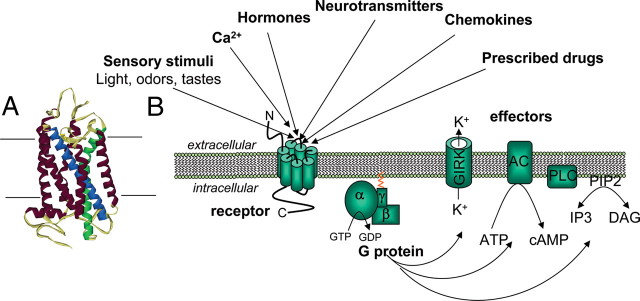
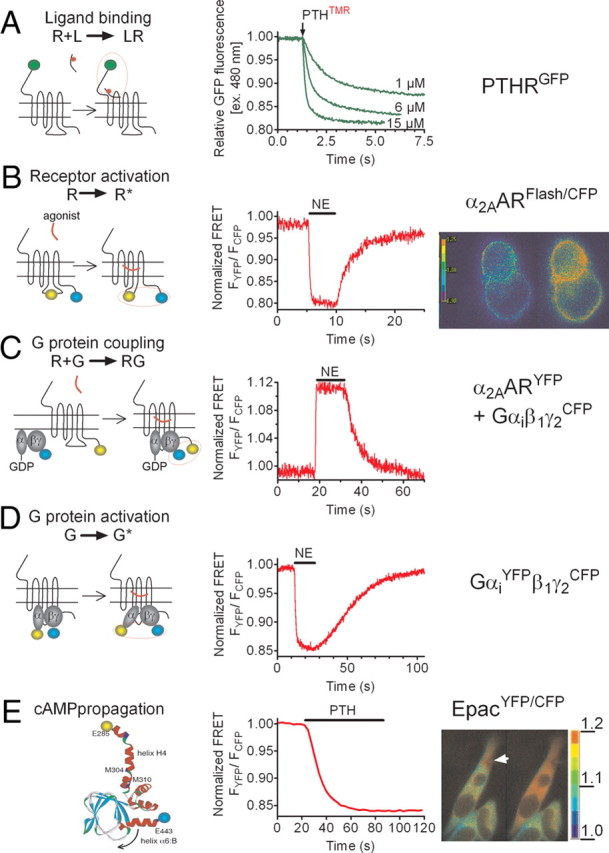
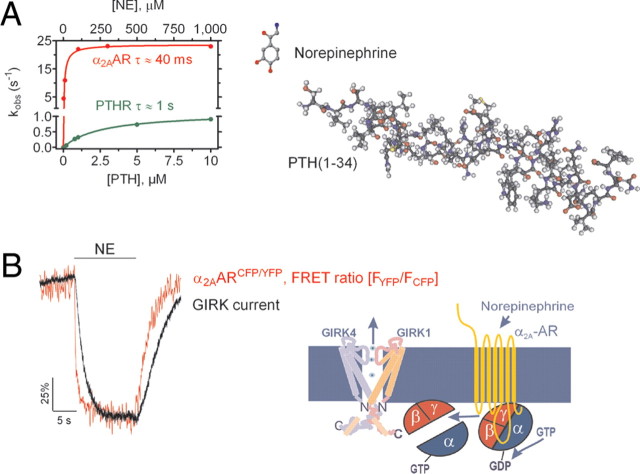
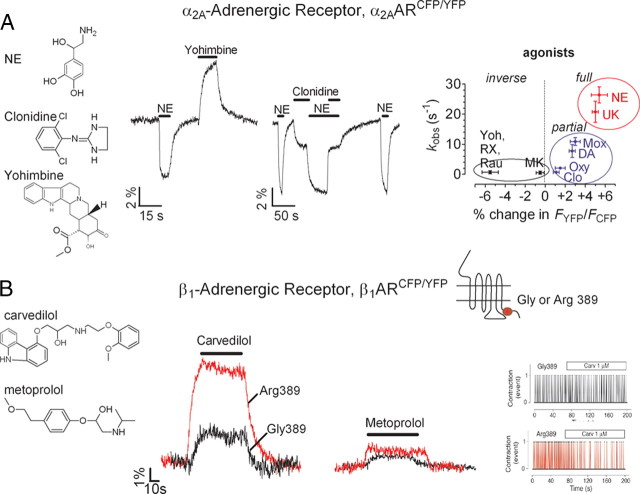
Many biochemical pathways are driven by G protein-coupled receptors, cell surface proteins that convert the binding of extracellular chemical, sensory, and mechanical stimuli into cellular signals. Their interaction with various ligands triggers receptor activation that typically couples to and activates heterotrimeric G proteins, which in turn control the propagation of secondary messenger molecules (e.g. cAMP) involved in critically important physiological processes (e.g. heart beat). Successful transfer of information from ligand binding events to intracellular signaling cascades involves a dynamic interplay between ligands, receptors, and G proteins. The development of Förster resonance energy transfer and bioluminescence resonance energy transfer-based methods has now permitted the kinetic analysis of initial steps involved in G protein-coupled receptor-mediated signaling in live cells and in systems as diverse as neurotransmitter and hormone signaling. The direct measurement of ligand efficacy at the level of the receptor by Förster resonance energy transfer is also now possible and allows intrinsic efficacies of clinical drugs to be linked with the effect of receptor polymorphisms.


Figures

Fig. 1.
Fig. 1.
Basic principle of GPCR-mediated signal transduction. A, Molecular representation of a GPCR based on the x-ray crystal structure of rhodopsin (1 ). Helices 3 and 6 are shown in blue and green, respectively. B, Basic pattern of ligand-mediated GPCR signal transduction. After ligand agonist binding, the receptor undergoes conformational changes, which promotes the coupling with heterotrimeric G proteins (Gαβγ) and catalyzes the exchange of GDP by GTP on the α-subunit. This event engages conformational and /or dissociational events between the α- and βγ-subunits, and both GTP-bound Gα-subunit and the Gβγ-dimer can then modulate the activity of various effectors. For example, stimulation or inhibition of adenylyl cyclase (AC)-mediated cAMP synthesis by the α-subunit of the Gs or Gi families, respectively; production of inositol 1,4,5-triphosphate (IP3) and 1,2-diacylglycerol (DAG) after cleavage of phosphatidylinositol 4,5-biphosphate (PIP2) by Gαq stimulation of phopholipase C (PLC); activation of Gi and Go also mediated most of the Gβγ-mediated signaling processes such as activation of GIRK.
Fig. 2.
Fig. 2.
Application of FRET for recording individual steps of GPCR activation in live cells. Ligand binding (A), receptor interaction (B), G protein coupling (C), G protein activation (D), cAMP propagation (E). The left panels illustrate the design of FRET sensors (green, GFP; blue, CFP, yellow, YFP), and the right panels represent the normalized YFP/CFP emission ratios (see Box 1 for details). A, Ligand-receptor interaction measured by FRET between GFP-tagged PTHR and TMR-labeled PTH. Shown are the changes of GFP emission by FRET in response to rapid superfusion of diverse concentrations of PTH(1-34)-TMR. [Adapted with permission from M. Castro et al.: Proc Natl Acad Sci USA 102:16084–16089, 2005 (19 ). ©National Academy of Sciences.] B, After norepinephrine (NE) application (horizontal bar), activation of α2AAR was monitored in a single HEK-293 cell by a decrease in the FRET signal of α2AARFlAsH/CFP defined as the ratio of emission intensities of FlAsH/CFP. [Adapted with permission from C. Hoffmann et al.: Nat Methods 2:171–176, 2005 (17 ). ©Nature Publishing Group.] C, The interaction between α2AAR and Gi proteins in response to NE is measured as an increase in FRET between YFP-labeled α2AAR and CFP-labeled Gγ2 in combination with Gαi1 and Gβ1 proteins. [Adapted with permission from P. Hein et al.: EMBO J 24:4106–4114, 2005 (36 ). ©European Molecular Biology Organization.] D, Detection of Gi activation in cells expressing the wild-type α2AAR by recording FRET between YFP-labeled Gαi and CFP-labeled Gγ2-subunits. [Adapted with permission from M. Bünemann et al.: Proc Natl Acad Sci USA 100:16077–16082, 2003 (49 ). ©National Academy of Sciences.] E, PTH-mediated cAMP response upon PTHR activation in HEK-293 cells measured as a decrease of FRET in the EpacCFP/YFP sensor. The right panels show the propagation of the cAMP response represented as pseudocolored image of the FRET (CFP/YFP emission) ratio before and after stimulation of a single cell with PTH(1–34) via a pipette indicated by an arrow at t = 0 sec. The scale bar on the right indicates the pseudocolored scale of the fluorescence ratios. The inner bar represents 5 μm. s, Seconds. [Adapted with permission from M. Castro et al.: Proc Natl Acad Sci USA 102:16084–16089, 2005 (19 ). ©National Academy of Sciences.]
Fig. 3.
Fig. 3.
Kinetics of receptor activation. A, Relationship between the apparent rate constant kobs of receptor activation and agonist concentrations. Size comparison of norepinephrine and PTH(1-34) are shown. [Adapted with permission from J.-P. Vilardaga et al.: Nat Biotechnol 21:807–812, 2003 (16 ). ©Nature Publishing Group.] B, Simultaneous recording of FRET responses and GIRK current from a single cell expressing α2AARCFP/YFP and GIRK1+4, and during continuous superfusion with control buffer or 100 μm norepinephrine (NE) (horizontal bar). ms, Milliseconds.
Fig. 4.
Fig. 4.
Direct recording of intrinsic efficacy at GPCRs. A, Example of FRET signal seen during sequential application of ligands of distinct efficacies to a single human embryonic kidney (HEK)-293 cell expressing α2AARYFP/CFP. [Adapted with permission from J.-P. Vilardaga et al.: Nat Chem Biol 1:25–28, 2005 (27 ). ©Nature Publishing Group.] The left trace represents the FRET signals mediated by the full agonist norepinephrine (NE), and by the inverse agonist yohimbine. The right trace represents the action of saturating concentrations of the full agonist NE or the partial agonist clonidine added alone or together. The simultaneous application of NE and clonidine restored the partial response seen with clonidine alone. This corresponds to the predicted properties of a high-affinity partial agonist. [Adapted with permission from J.-P. Vilardaga et al.: Nat Biotechnol 21:807–812, 2003 (16 ). ©Nature America Publishing.] The right panel represents the correlation between the rate constant of receptor activation, and respective extent of FRET amplitude seen with ligands of different efficacies. Norepinephrine (NE), UK-14,403 (UK), dopamine (DA), moxonidine (Mox), oxymetazoline (Oxy), clonidine (Clo), RX821002 (RX), yohimbine (Yoh), and rauwolscine (Rau). [Adapted with permission from J.-P. Vilardaga et al.: Nat Chem Biol 1:25–28, 2005 (27 ). ©Nature Publishing Group.] B, Effect of β1-AR polymorphisms on β-blocker responses. FRET signals in cells expressing the Gly389-β1ARCFP/YFP sensor (black traces) or the Arg389-β1ARCFP/YFP sensor (red traces) after application of the β-blockers carvedilol or metoprolol. The right panel represents tracing of the beating frequency of primary cardiomyocytes expressing the Gly389-β1ARCFP/YFP or the Arg389-β1ARCFP/YFP before and after stimulation with carvedilol. The marked inverse agonist effect of carvedilol on the Arg389-β1AR led to a significant reduction of the beating frequency of cells carrying this receptor variant. s, Seconds. [Adapted with permission from F. Rochais et al.: J Clin Invest 117:229–235, 2007 (18 ). ©American Society for Clinical Investigation.]
Fig. 5.
Fig. 5.
FRET-based detection of receptor-G protein interaction and G protein activation in single cells. A, FRET between fluorescent α2AAR and fluorescent heterotrimeric Gi proteins was detected in single cells. When agonist [norepinephrine NE)] was applied, receptor/G protein complex formation resulted in generation of a FRET signal. The amplitude of the FRET was dramatically increased when using a N270D mutation of Gαi1 (Gαi1-ND), which prolongs receptor-G protein interaction (36 ). These results led to the conclusion that wild type (WT) G proteins only interact with activated receptors and that the time period of interaction is short relative to the G protein cycle. B, FRET-based measurement of mammalian Gi protein activity revealed increased FRET between α- and βγ-subunits during activation, challenging the widely accepted hypothesis of subunit dissociation after activation. Comparison of Gi (left panel) and Go (right panel) protein activation revealed a differential activation pattern of Gi and Go proteins. Whether Gαo-containing heterotrimers dissociate or just undergo a differential subunit rearrangement remains an open question. s, Seconds. [Adapted with permission from M. Bünemann et al.: Proc Natl Acad Sci USA 100:16077–16082, 2003 (49 ). ©National Academy of Sciences; and M. Frank et al.: J Biol Chem 280:24584–24590, 2005 (50 ). ©American Society for Biochemistry and Molecular Biology.]
Fig. 6.
Fig. 6.
(Box 1). Principle of FRET experiments. A–H, Examples of intermolecular and intramolecular FRET experiments showing direct recordings of norepinephrine (NE)-mediated activation of the α2A-AR and its interaction with the heterotrimeric G protein. Experiments were performed under a fluorescence microscope, where light at 436 nm selectively excited a single cell expressing α2A-ARFlAsH/CFP (A), or coexpressing α2AAR C-terminally tagged with YFP (α2A-ARYFP) together with Gαi1, Gβ1, andGγ2 N-terminally tagged with CFP (Gγ2CFP) (E) to induce donor (CFP) and acceptor (FlAsH or yellow) emission fluorescences simultaneously recorded over time (B and F). FRET was calculated as the ratio of corrected emission intensities FYFP/FCFP (C and G). D and H, Relationship between the time constant of α2A-ARFlAsH/CFP activation (D), or α2A-ARCFP/Gαi1β1γ2YFP interaction (H) after stimulation by NE (100 μm) and receptor or G protein concentrations. Time constant values are obtained from fitting the kinetic data of experiments like those of Fig. 6, C and G. For the intermolecular receptor-G protein interaction, the kinetics depended on expression levels of Gi. I–K, Determination of specific and nonspecific FRET between membrane proteins. The efficiency of FRET, calculated by the recovery of donor emission after acceptor photobleaching (J), of a specific association between receptors C-terminally tagged with CFP or YFP increases as a hyperbolic function of the concentration of the acceptor (K). In contrast, nonspecific interactions between membrane-anchored CFP and YFP molecule, which is caused by random distribution and collision, gave a linear increase in FRET efficiency. s, Seconds; ms, milliseconds. [Adapted with permission from P. Hein et al.: EMBO J 24:4106–4114, 2005 (36 ). ©European Molecular Biology Organization; and J.-P. Vilardaga et al.: Nat Chem Biol 4:126–131, 2008 (72 ). ©Nature Publishing Group.]

Similar articles

Cited by

References

    1. Palczewski K, Kumasaka T, Hori T, Behnke CA, Motoshima H, Fox BA, Le Trong I, Teller DC, Okada T, Stenkamp RE, Yamamoto M, Miyano M2000. Crystal structure of rhodopsin: a G protein-coupled receptor. Science 289:739–745 - PubMed
    1. Rosenbaum DM, Cherezov V, Hanson MA, Rasmussen SG, Thian FS, Kobilka TS, Choi HJ, Yao XJ, Weis WI, Stevens RC, Kobilka BK GPCR engineering yields high-resolution structural insights into β2-adrenergic receptor function. Science 318:1266–1273 - PubMed
    1. Bourne HR, Sanders DA, McCormick F1991. The GTPase superfamily: conserved structure and molecular mechanism. Nature 349:117–127 - PubMed
    1. Wettschureck N, Offermanns S2005. Mammalian G proteins and their cell type specific functions. Physiol Rev 85:1159–1204 - PubMed
    1. Tao YX2006. Inactivating mutations of G protein-coupled receptors and diseases: structure-function insights and therapeutic implications. Pharmacol Ther 111:949–973 - PubMed

Publication types

MeSH terms

Substances