. 2009 Mar 18;28(6):677-85.
doi: 10.1038/emboj.2009.8. Epub 2009 Feb 5.

TAK1 activates AMPK-dependent cytoprotective autophagy in TRAIL-treated epithelial cells

Affiliations

TAK1 activates AMPK-dependent cytoprotective autophagy in TRAIL-treated epithelial cells

Griselda Herrero-Martín et al. EMBO J. .

Erratum in

  • EMBO J. 2009 May 20;28(10):1532

Abstract

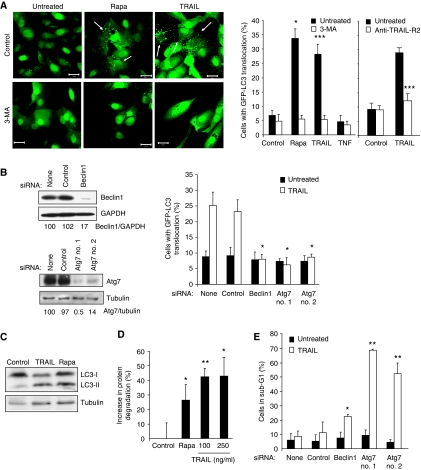
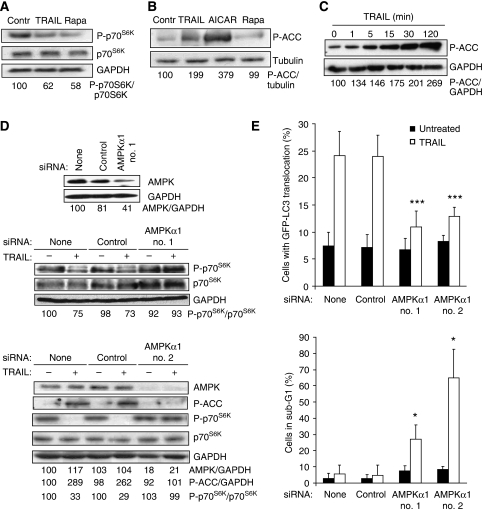
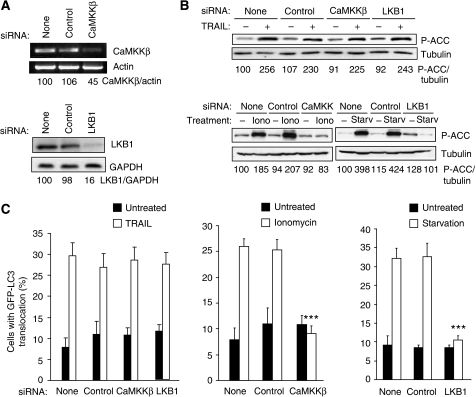
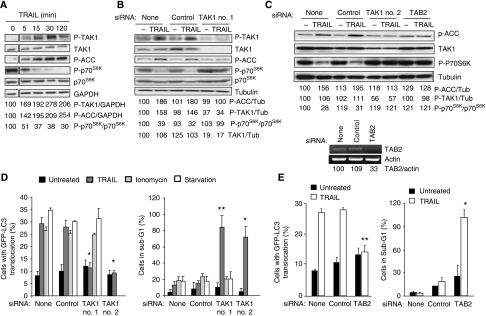
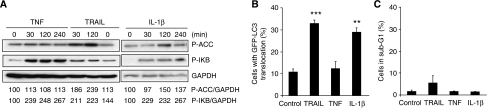
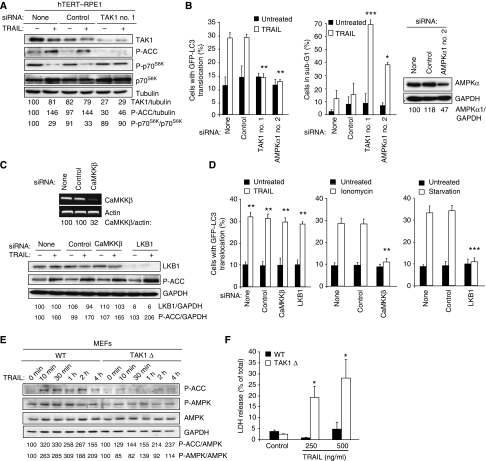
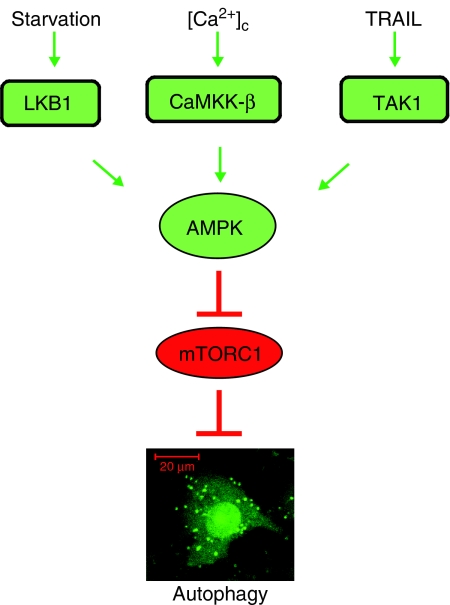
The capacity of tumour necrosis factor-related apoptosis-inducing ligand (TRAIL) to trigger apoptosis preferentially in cancer cells, although sparing normal cells, has motivated clinical development of TRAIL receptor agonists as anti-cancer therapeutics. The molecular mechanisms responsible for the differential TRAIL sensitivity of normal and cancer cells are, however, poorly understood. Here, we show a novel signalling pathway that activates cytoprotective autophagy in untransformed human epithelial cells treated with TRAIL. TRAIL-induced autophagy is mediated by the AMP-activated protein kinase (AMPK) that inhibits mammalian target of rapamycin complex 1, a potent inhibitor of autophagy. Interestingly, the TRAIL-induced AMPK activation is refractory to the depletion of the two known AMPK-activating kinases, LKB1 and Ca(2+)/calmodulin-dependent kinase kinase-beta, but depends on transforming growth factor-beta-activating kinase 1 (TAK1) and TAK1-binding subunit 2. As TAK1 and AMPK are ubiquitously expressed kinases activated by numerous cytokines and developmental cues, these data are most likely to have broad implications for our understanding of cellular control of energy homoeostasis as well as the resistance of untransformed cells against TRAIL-induced apoptosis.


Figures

Figure 1
Figure 1
TRAIL induces cytoprotective autophagy in breast epithelial cells. (A) MCF10A–eGFP–LC3 cells were left untreated (Control) or treated with 5 μM rapamycin (Rapa), 500 ng/ml TRAIL or 10 ng/ml TNF for 24 h. When indicated, 10 mM 3-MA or 5 μg/ml TRAIL-R2 antagonist antibody was added 1 h before the drugs. Representative confocal images (20 μm scale bars) and the percentages of cells with LC3 translocation are shown. (B) MCF10A–eGFP–LC3 cells were transfected with the indicated siRNAs for 48 h and analysed by immunoblotting (left), or stimulated with 500 ng/ml TRAIL for 24 h and analysed for LC3 translocation (right). (C) MCF10A cells left untreated (Control) or treated with 500 ng/ml TRAIL or 5 μM rapamycin (Rapa) for 24 h were analysed for LC3-I, LC3-II and tubulin by immunoblotting. Pepstatin A and E64d were added to the cells 4 h before harvesting. Similar results were obtained in two independent experiments. (D) MCF10A cells were treated with 5 μM rapamycin (Rapa) or indicated concentrations of TRAIL for 24 h, and the increase in the degradation of long-lived proteins as compared with the untreated cultures (Control) was measured. (E) MCF10A–eGFP–LC3 cells transfected with the indicated siRNAs were left untreated 48 h later (Control) or treated with 500 ng/ml TRAIL for 24 h and analysed for the DNA content by flow cytometry. The percentage of apoptotic cells with sub-G1 DNA content is shown. The values represent mean±s.d. for three (A, D) or four (B, E) independent experiments. *P-value <0.05, **P-value <0.01 and ***P-value <0.001 as compared with control sample (A—left panel and D), with TRAIL-treated cells without anti-TRAIL-R2 (A—right panel) or with TRAIL-treated cells without siRNA (B, E).
Figure 2
Figure 2
TRAIL activates AMPK and AMPK-dependent cytoprotective autophagy. (A) Protein lysates from MCF10A cells left untreated or treated with 500 ng/ml TRAIL or 5 μM rapamycin (Rapa, positive control) for 24 h were analysed by immunoblotting for phosphorylated p70S6K (P-p70S6K), total p70S6K and GAPDH (loading control). (B) Immunoblot analysis of the levels of P-ACC and tubulin (loading control) in lysates from MCF10A cells left untreated or treated with 500 ng/ml TRAIL for 24 h, 1 mM AICAR for 4 h (positive control) or 5 μM rapamycin for 24 h (negative control). (C) Immunoblot analysis of the level of P-ACC and GAPDH (loading control) in lysates from MCF10A cells treated with 500 ng/ml TRAIL for the indicated times. (D) MCF10A cells were transfected with indicated siRNAs for 48 h and analysed by immunoblotting for the indicated proteins immediately (upper panel) or after additional 24 h (middle panel) or 2 h (lower panel) incubation with (+) or without (−) 500 ng/ml TRAIL. (E) MCF10A–eGFP–LC3 cells transfected with indicated siRNAs for 48 h and incubated for an additional 24 h with or without 500 ng/ml TRAIL were analysed for LC3 translocation (top) and the DNA content (bottom). The values represent mean±s.d. for four independent experiments. *P-value <0.05 and ***P-value <0.001 as compared with TRAIL-treated cells without siRNA. Similar results were obtained in two (A, B and D) or three (C, D) independent experiments.
Figure 3
Figure 3
LKB1 and CaMKKβ do not have an important function in TRAIL-induced AMPK activation and autophagy. (A) MCF10A–eGFP–LC3 cells were transfected with indicated siRNAs for 48 h and analysed for the indicated mRNAs (top) and proteins (bottom by RT–PCR and immunoblotting, respectively. Similar results were obtained in three independent experiments. (B) MCF10A–eGFP–LC3 cells transfected with indicated siRNAs for 48 h, and left untreated or treated with 500 ng/ml TRAIL for 2 h, 10 μM ionomycin for 24 h or starved for amino acids and glucose for 24 h (starvation) were analysed for P-ACC and tubulin (loading control) expression by immunoblotting. Similar results were obtained in two independent experiments. (C) Cells transfected as in (B) and left untreated or treated with 500 ng/ml TRAIL, 10 μM ionomycin or starved for amino acids and glucose for 24 h were analysed for LC3 translocation. The values represent mean±s.d. of three independent experiments. ***P-value <0.001 as compared with cells treated in a same way, but transfected without siRNA.
Figure 4
Figure 4
TAK1 mediates TRAIL-induced AMPK activation and autophagy. (A) The lysates of MCF10A cells treated with 500 ng/ml TRAIL for the indicated times were analysed by immunoblotting. The control lane (0 min TRAIL) originates from the same blot and has been treated and exposed identically. Similar results were obtained in three independent experiments. (B, C) The lysates of MCF10A–eGFP–LC3 cells transfected with indicated siRNAs for 48 h and left untreated (−) or treated with 500 ng/ml TRAIL for 2 h were analysed by immunoblotting. (C, lower panel) MCF10A–eGFP–LC3 cells were transfected with indicated siRNAs for 48 h and analysed for the indicated mRNAs by RT–PCR. Similar results were obtained in two independent experiments. (D, E) MCF10A–eGFP–LC3 cells were transfected with indicated siRNAs for 48 h, treated as in Figure 3C and analysed for LC3 translocation (left) and sub-G1 DNA content (right). The values represent mean±s.d. of a minimum of three independent experiments except for the right panel in E (two experiments). *P-value <0.05 and **P-value <0.01 as compared with cells treated in a same way, but transfected without siRNA.
Figure 5
Figure 5
IL-1β activates AMPK and autophagy. (A) Protein lysates from MCF10A cells left untreated (0) or treated with 50 ng/ml TNF, 500 ng/ml TRAIL (positive control) or 10 ng/ml IL-1β for indicated times were analysed by immunoblotting for phosphorylated ACC (P-ACC), phosphorylated IκB (P-IκB) and GAPDH (loading control). The values show the P-ACC/GAPDH and P-IkB/GAPDH ratios as percentages of the ratios in untreated cells (left lanes) and are representative of two independent experiments. (B, C) MCF10A–eGFP–LC3 cells left untreated or treated with 500 ng/ml TRAIL, 50 ng/ml TNF or 10 ng/ml IL-1β for 24 h were analysed for LC3 translocation (B) and the DNA content (C). The values represent mean±s.d. for two independent experiments. **P-value <0.01 and ***P-value <0.001 as compared with untreated cells.
Figure 6
Figure 6
TRAIL induces TAK1-dependent AMPK activation and autophagy in retinal pigment epithelial cells. (A) The lysates of hTERT–RPE1 cells transfected with indicated siRNAs for 48 h and left untreated or treated with 500 ng/ml TRAIL for 2 h were analysed by immunoblotting. (B) hTERT–RPE1–eGFP–LC3 cells transfected with indicated siRNAs for 48 h were left untreated or treated with 500 ng/ml TRAIL for 24 h and analysed for LC3 translocation (left) and sub-G1 DNA content (middle) and AMPKα expression (right). (C) hTERT–RPE1–eGFP–LC3 cells were transfected with indicated siRNAs for 48 h and analysed for the indicated mRNAs (top). After 48 h, cells were left untreated or treated with 500 ng/ml TRAIL for 2 h, and analysed for P-ACC and GAPDH (loading control) expression by immunoblotting. Similar results were obtained in two independent experiments. (D) Cells transfected as described in (C) and left untreated or treated with 500 ng/ml TRAIL, 10 μM ionomycin or starved for amino acids and glucose for 24 h were analysed for LC3 translocation. (E) Lysates of wild-type (WT) MEFs and MEFs with an inactive TAK1 knock-in (TAK1Δ) treated with 500 ng/ml TRAIL were analysed by immunoblotting. Similar results were obtained in two independent experiments. (F) WT and TAK1Δ MEFs left untreated and treated with 250 or 500 ng/ml TRAIL were analysed for cell death by the LDH release assay. Similar results were obtained in two independent experiments (A, C and E). The values represent mean±s.d. for two (D) or a minimum of three independent experiments (B, F). *P-value <0.05, **P-value <0.01 and ***P-value <0.001 as compared with cells treated in the same way, but transfected without siRNA (B, D) or the wild-type cells (F).
Figure 7
Figure 7
A schematic presentation of various signalling pathways leading to AMPK activation and AMPK-dependent autophagy.

References

    1. Adhikari A, Xu M, Chen ZJ (2007) Ubiquitin-mediated activation of TAK1 and IKK. Oncogene 26: 3214–3226 - PubMed
    1. Ashkenazi A, Herbst RS (2008) To kill a tumor cell: the potential of proapoptotic receptor agonists. J Clin Invest 118: 1979–1990 - PMC - PubMed
    1. Brenman JE (2007) AMPK/LKB1 signaling in epithelial cell polarity and cell division. Cell Cycle 6: 2755–2759 - PubMed
    1. Codogno P, Meijer AJ (2005) Autophagy and signaling: their role in cell survival and cell death. Cell Death Differ 12 (Suppl 2): 1509–1518 - PubMed
    1. Corradetti MN, Inoki K, Bardeesy N, DePinho RA, Guan KL (2004) Regulation of the TSC pathway by LKB1: evidence of a molecular link between tuberous sclerosis complex and Peutz–Jeghers syndrome. Genes Dev 18: 1533–1538 - PMC - PubMed

Publication types

MeSH terms

Substances