. 2009 Feb;5(2):e1000287.
doi: 10.1371/journal.ppat.1000287. Epub 2009 Feb 6.

Rift Valley fever virus NSs protein promotes post-transcriptional downregulation of protein kinase PKR and inhibits eIF2alpha phosphorylation

Affiliations

Rift Valley fever virus NSs protein promotes post-transcriptional downregulation of protein kinase PKR and inhibits eIF2alpha phosphorylation

Tetsuro Ikegami et al. PLoS Pathog. 2009 Feb.

Abstract

Rift Valley fever virus (RVFV) (genus Phlebovirus, family Bunyaviridae) is a negative-stranded RNA virus with a tripartite genome. RVFV is transmitted by mosquitoes and causes fever and severe hemorrhagic illness among humans, and fever and high rates of abortions in livestock. A nonstructural RVFV NSs protein inhibits the transcription of host mRNAs, including interferon-beta mRNA, and is a major virulence factor. The present study explored a novel function of the RVFV NSs protein by testing the replication of RVFV lacking the NSs gene in the presence of actinomycin D (ActD) or alpha-amanitin, both of which served as a surrogate of the host mRNA synthesis suppression function of the NSs. In the presence of the host-transcriptional inhibitors, the replication of RVFV lacking the NSs protein, but not that carrying NSs, induced double-stranded RNA-dependent protein kinase (PKR)-mediated eukaryotic initiation factor (eIF)2alpha phosphorylation, leading to the suppression of host and viral protein translation. RVFV NSs promoted post-transcriptional downregulation of PKR early in the course of the infection and suppressed the phosphorylated eIF2alpha accumulation. These data suggested that a combination of RVFV replication and NSs-induced host transcriptional suppression induces PKR-mediated eIF2alpha phosphorylation, while the NSs facilitates efficient viral translation by downregulating PKR and inhibiting PKR-mediated eIF2alpha phosphorylation. Thus, the two distinct functions of the NSs, i.e., the suppression of host transcription, including that of type I interferon mRNAs, and the downregulation of PKR, work together to prevent host innate antiviral functions, allowing efficient replication and survival of RVFV in infected mammalian hosts.


Conflict of interest statement

The authors have declared that no competing interests exist.

Figures

Figure 1
Figure 1. Effects of ActD on the replication and protein synthesis of MP-12 and MP-12 lacking the NSs gene.
(A) Schematic representations of the S segments of MP-12, rMP12-rLuc, and rMP12-C13type. (B) Type I IFN-deficient VeroE6 cells were mock-treated or independently infected with MP-12 and rMP12-rLuc at an moi of 3, immediately treated with ActD (5 µg/ml) or untreated, and culture fluids were harvested at 16 h.p.i. Virus titers of MP-12 and rMP12-rLuc were measured by a plaque assay. The virus replication of rMP12-rLuc was significantly reduced in the presence of ActD (*p<0.001; Student's t-test). Data are expressed as mean+/−standard deviation of three independent experiments. (C) Vero cells were mock-infected or independently infected with MP-12, rMP12-rLuc, and rMP12-C13type as described above. Cells were radiolabelled with [35S] labelled Methionine/Cysteine between 15 h.p.i. and 16 h.p.i. Cell extracts were prepared at 16 h.p.i. and applied to SDS-PAGE (top panel). Intensities of signals in three separate areas (area 1, 2, and 3), which were determined by densitometric analysis, are shown at the bottom of the top panel. Signal intensities of the mock-infected cells were used as the scale to measure the others and were considered as 100%. The intensities of RVFV N proteins were also shown at the bottom of the top panel (N). The signal intensity of N protein in MP-12–infected cells in the absence of ActD was represented as 100%. For Western blot analysis (middle and bottom panels), cell extracts from mock-infected cells and infected cells were prepared at 16 h.p.i., and analyzed in a Western blot in which we used an anti-RVFV antibody (middle panel) and an anti–β-actin antibody (bottom panel). Data are representative of three independent experiments.
Figure 2
Figure 2. Effects of NSs protein expression on the viral replication of rMP12-rLuc in the presence of ActD.
293 cells were infected with rMP12-rLuc at an moi of 2, transfected with in vitro–synthesized RNA transcripts encoding CAT, MP-12 NSs, or ZH501 NSs, and treated with ActD or were left untreated. Shown are the rLuc activities (A), virus titers (B), and protein accumulations (C) at 16 h.p.i. (A,B) The data were presented as mean+/−standard deviation of three independent experiments, all of which had p values determined by using Student's t-test (*p<0.05). (C) The expression levels of N, NSs, CAT-myc-His, and β-actin were determined by Western blotting using anti-RVFV antibody (a-RVFV), anti-NSs antibody (a-NSs), anti-myc antibody (a-Myc), and anti–β-actin antibody (a-β-actin), respectively. The data are representative of three independent experiments.
Figure 3
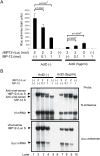
Figure 3. Effect of MP-12 replication on translation of rLuc mRNA of rMP12-rLuc.
VeroE6 cells were mock-infected, individually infected with rMP12-rLuc and MP-12, or co-infected with both viruses at the moi indicated in the figure. ActD (5 µg/ml) was added immediately after infection, and cell extracts were harvested at 16 h.p.i. (A) The rLuc activities are presented as mean+/−standard deviation of three independent experiments, for which we determined the p values by using Student's t-test (*p<0.05). (B) Northern blot analysis of S-segment RNA, N mRNA, and rLuc mRNA using RNA probe specific to N mRNA and the antiviral-sense S-segment (N antisense) or rLuc mRNA (rLuc antisense). The data are the representative of three independent experiments.
Figure 4
Figure 4. Status of eIF2α phosphorylation in rMP12-rLuc–infected cells and MP-12–infected cells in the presence of transcriptional inhibitors.
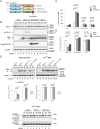
VeroE6 cells were mock-infected (M) or infected with rMP12-rLuc or MP-12 at an moi of 3, and then immediately treated with ActD (5 µg/ml) or α-amanitin (50 µg/ml), or left untreated (No drug). Samples were harvested at the indicated time points post-infection for Western blot analysis or virus titration. The data shown in the graphs (mean+/−standard deviation) were obtained from three independent experiments with p values determined using Student's t-test (*: p<0.05 compared to No drug at each time point). (A) Western blot analyses of RVFV N protein, phosphorylated eIF2α, total eIF2α, and β-actin. The data are representative of three independent experiments. (B) The relative abundance of phosphorylated eIF2α and total eIF2α at various times post-infection. The relative abundance of phosphorylated eIF2α normalized to total eIF2α at 0 h.p.i. is represented as 100%. (C) Accumulation of N protein at various times p.i. The abundance of N protein at 4 h p.i represented as 100% for each of three groups. (D) Kinetics of virus titers in the culture fluids of the infected cells.
Figure 5
Figure 5. Role of PKR in eIF2α phosphorylation in infected cells under transcriptional suppression.
VeroE6 cells (B,C,D), wild-type MEF cells, or Pkr0/0 MEF cells (E) were independently infected with MP-12, rMP12-rLuc, and rMP12-PKRΔE7 at an moi of 3, or were mock-infected. Cells were immediately treated with 5 µg/ml of ActD (Act) or 50 µg/ml of α-amanitin (Ama), or were untreated. Cell extracts were prepared at 16 h.p.i. for Western blot analysis (B,E), and culture fluids were collected for virus titration (D,E). The data shown in the graphs (mean+/−standard deviation) were obtained from three independent experiments with p values of Student's t-test (*: p<0.05). The Western blot data is representative of three independent experiments. (A) Schematic representations of S segments of MP-12, rMP12-rLuc, and rMP12-PKRΔE7. (B) Western blot analysis showing the accumulation of eIF2α, phosphorylated eIF2α, N protein, NSs protein, Flag-PKRΔE7, and β-actin in infected VeroE6 cells. (C) Relative abundance of phosphorylated eIF2α and total eIF2α are shown in (B). The relative abundance of phosphorylated eIF2α and total eIF2α in mock-infected, untreated cells represents 100%. (D) Virus titers of rMP12-rLuc, rMP12-PKRΔE7, or MP-12 in VeroE6 cells. (E) Accumulation of RVFV N proteins and β-actin in wild-type MEF cells or in Pkr0/0 MEF cells. M represents mock-infected cells. Middle left panel and middle right panel represent virus titers in wild-type MEF cells and in Pkr0/0 MEF cells, respectively. The bottom panel shows the amounts of total eIF2α, phosphorylated eIF2α and β-actin in mock-infected cells (Mock), MP-12 infected cells, and rMP12-rLuc–infected cells in the presence of 5 µg/ml of ActD (Act), 50 µg/ml of α-amanitin (Ama), or in the absence of the drugs (M).
Figure 6
Figure 6. Testing dsRNA binding activity of NSs protein and autophosphorylation of PKR in infected cells.
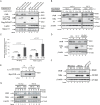
(A) Schematic representations of RVFV S segments of rMP12-NSs-Flag and rMP12-rLuc-Flag. (B) 293 cells were mock-infected (Mock) or infected with rMP12-rLuc-Flag, rMP12-NSs-Flag, or rMP12-PKRΔE7 at an moi of 3 (left panel). In the right panel, 293 cells were transfected with in vitro–synthesized RNA transcripts encoding RVFV MP-12 NSs. At 16 h.p.i. or 16 h post-transfection, cytoplasmic lysates (L) were incubated with poly C (pC) beads or poly I∶C (pIC) beads. The dsRNA binding activity of the NSs was analyzed as described in Materials and Methods. Proteins bound to beads were analyzed by Western blotting using anti-Flag antibody (left panel) or anti-NSs antibody (right panel). Asterisk (*) represents the NSs. (C) 293 cells were infected with rMP12-rLuc or MP-12 at an moi of 3. After infection, cells were mock-treated (−) or immediately treated with ActD (+) at 5 µg/ml. Total RNA was harvested at 8 h.p.i., and accumulations of IFN-β mRNA, antiviral-sense S segment RNA, N mRNA, and GAPDH mRNA were analyzed by Northern blot. (D) 293 cells were mock-infected or infected with rMP12-NSs-Flag, rMP12-rLuc-Flag, or rMP12-PKRΔE7 at an moi of 3, and, then, cells were mock-treated (No drug) or immediately treated with 5 µg/ml of ActD. A cytoplasmic fraction was collected at 16 h.p.i. and the IP-kinase assay of PKR was performed as described in Materials and Methods (top panel). A part of samples was used for Western blot analysis by using anti-PKR monoclonal antibody to show the abundance of immunoprecipitated PKR (bottom panel). Data are representative of two independent experiments (B–D).
Figure 7
Figure 7. Analysis of NSs-induced PKR downregulation.
(A) 293 cells were mock-infected (Mock) or independently infected with rMP12-NSs-Flag, rMP12-rLuc-Flag, and rMP12-PKRΔE7 at an moi of 3. Cells were immediately treated with 5 µg/ml of ActD, and both cytoplasmic (C) and nuclear (N) fractions were collected at 16 h.p.i. Results are shown of Western blot analysis performed by using anti-PKR antibody, anti-Flag antibody, anti–β-actin antibody, and anti-Histone H1 antibody. (B) 293 cells were mock-infected (Mock) or infected with rMP12-rLuc at an moi of 3. Then cells were mock-transfected (M) or transfected with in vitro–synthesized RNA transcripts encoding rLuc (rLuc) or NSs (NSs). Cells were then treated with 5 µg/ml of ActD. Whole-cell lysates were collected at 16 h.p.i. (left panel). Another set of cells were mock-transfected or transfected with in vitro–synthesized RNA transcripts encoding NSs or rLuc, and cell extracts were harvested at 8 h post-transfection (right panel). Western blot analysis was performed by using anti-PKR antibody, anti-RVFV antibody, and anti–β-actin antibody. Lane 10 represents the cell lysate of rMP12-rLuc–infected cells harvested at 8 h.p.i. in the absence of ActD. (C) 293 cells were mock-transfected or transfected with in vitro–synthesized RNA transcripts encoding MP-12 NSs or rLuc. Cells were mock-treated or treated with 5 µg/ml of ActD. Total RNA was harvested at 8 h post-transfection, and analyzed by real-time PCR. The relative abundance of PKR mRNA of each sample was calculated by the ΔΔCT method based on the abundance of 18S ribosomal RNA. The data shown in the graph (mean+/−standard deviation) were obtained from three independent experiments. The p value was determined by Student's t-test (*: p<0.05). (D) 293 cells were mock-infected (Mock) or infected with MP-12 at an moi of 3 or transfected with in vitro–synthesized RNA transcripts encoding NSs. Cells were then mock-treated or treated with 100 µg/ml of puromycin. Cell extracts were harvested at 16 h.p.i. or 16 h post-transfection, and the abundance of PKR and viral proteins were analyzed by Western blotting with anti-PKR antibody (top panel), anti-RVFV antibody (middle panel), or anti–β-actin antibody (bottom panel). (E) 293 cells were mock-transfected or transfected with pcDNA3.1-Myc-PKRK296R. Cells were radiolabelled with [35S] Methionine/Cysteine between 14 and 16 h post-transfection. Then, cells were harvested (0 h), or transfected with in vitro–synthesized RNA transcripts encoding rLuc or MP-12 NSs. At 8 h post–RNA transfection, cells were harvested (8 h). Radiolabelled myc-tagged PKR was immunoprecipitated by anti-myc monoclonal antibody, analyzed by SDS-PAGE with 7.5% poryacrylamide gel, and visualized by autoradiography. (F) 293 cells were infected with rMP12-rLuc or MP-12 at an moi of 3, and, then, treated with 10 µM of MG132 (MG) or 50 µM of lactacystin (LA) or they were mock-treated (−). Whole-cell lysates were collected at 8 h.p.i., and the abundance of PKR, NSs and β-actin were examined by Western blot analysis. (G) 293 cells were mock-infected (Mock) or infected with MP-12 (MP-12) at an moi of 3, and treated with MG132 (MG132) at 10 µM or they were untreated (no drug used). Whole-cell lysates were collected at 2, 4, 6, and 8 h.p.i. Anti-PKR antibody, anti-NSs antibody, and anti–β-actin antibody were used to detect PKR, NSs, and β-actin, respectively (F and G). Data are representative of two to three independent experiments (A–G).

References

    1. Peters CJ. Rift Valley fever. Handbook Series of Zoonoses, Section B: Viral Zoonoses, Vol 1. CRC Press; 1981.
    1. Morvan J, Rollin PE, Laventure S, Rakotoarivony I, Roux J. Rift Valley fever epizootic in the central highlands of Madagascar. Res Virol. 1992;143:407–415. - PubMed
    1. Meegan JM. The Rift Valley fever epizootic in Egypt 1977–78. 1. Description of the epizootic and virological studies. Trans R Soc Trop Med Hyg. 1979;73:618–623. - PubMed
    1. El-Akkad AM. Rift Valley fever outbreak in Egypt. October–December 1977. The Journal of the Egyptian Public Health Association. 1978;53:123–128. - PubMed
    1. Arthur RR, el-Sharkawy MS, Cope SE, Botros BA, Oun S, et al. Recurrence of Rift Valley fever in Egypt. Lancet. 1993;342:1149–1150. - PubMed

Publication types

MeSH terms